
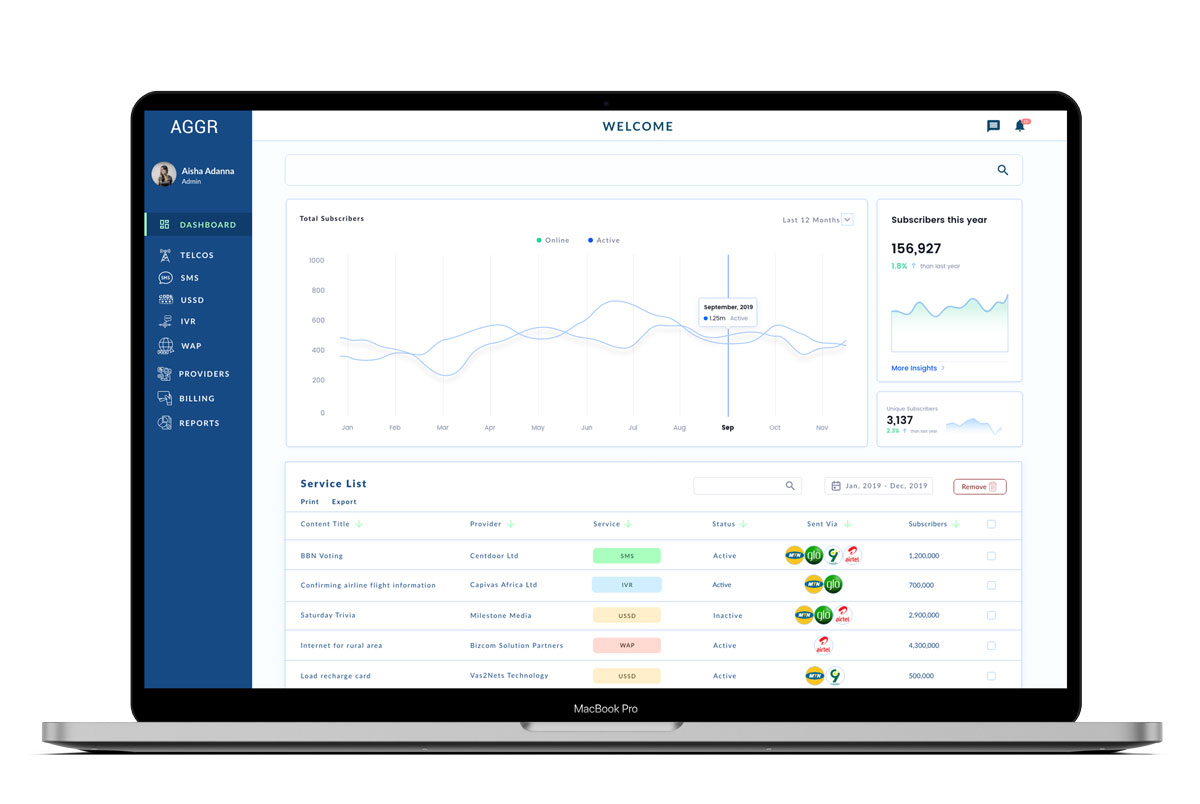
An enterprise platform designed to simplify complex workflows, reduce cognitive load, and improve operational accuracy in data-heavy environments.
AGGR is an internal enterprise platform designed to help service providers manage aggregation, billing, and reporting across multiple telecom and content partners. The tool centralizes fragmented workflows into a single interface, enabling teams to configure services, track revenue, and generate reports more efficiently and accurately.
This project focused on designing a scalable UX system for complex, high-stakes workflows where clarity, consistency, and error prevention are critical.
Timeframe
3 Months
My Role
Lead Product Designer (Enterprise UX)
Tools
Figma, FigJam, Miro, Photoshop
Services
Leading stakeholder interviews and workflow analysis
Defining information architecture for complex data structures
Designing interaction patterns for billing, reporting, and user management
Creating and iterating high-fidelity prototypes for validation
The Problem
The Value-Added Services (VAS) ecosystem operates across multiple stakeholders—including telecommunications companies (telcos), service providers, and content providers—yet lacks a centralized system to manage and distribute services effectively.
As a result:
- Services are fragmented across platforms
- User experiences are inconsistent and disjointed
- Stakeholders struggle to access, compare, and manage services efficiently
High cognitive load when switching between systems
Inconsistent workflows across teams
Increased risk of errors in revenue allocation and reporting
Users needed a single, coherent platform that could support complex configurations while remaining predictable, efficient, and easy to learn.
Challenge:
Design a centralized VAS aggregation platform that unifies services while enabling efficient workflows, transparent data handling, and seamless user experience across stakeholders.
Goals & Success Criteria
User Goals
Quickly understand service configurations across multiple providers
Perform billing and reporting tasks with confidence and accuracy
Reduce time spent navigating between tools and interfaces
Business Goals
Centralize aggregation and revenue workflows
Improve operational efficiency
Reduce errors in financial reporting
Success Metrics (Prototype Testing)
~30% reduction in time to complete core billing workflows
85% task success rate across key reporting tasks
Reduced error occurrences during revenue assignment tasks
Constraints & Considerations
Limited access to live competitor platforms
Complex business logic evolving in parallel with design
Need to design for scalability as services and partners grow
These constraints informed a modular, system-driven UX approach that could evolve alongside the product.
Problem Research
Key Findings
1. Decentralized system caused operational inefficiency
Each entity in the VAS chain operated independently, leading to:
- Poor data flow
- Lack of synchronization between stakeholders
This resulted in fragmented workflows and increased manual effort.
2. No clear system model or mental framework
Stakeholders lacked clarity on:
- How the platform should function
- How different components should interact
Users were unable to form a mental model of the system, increasing cognitive load.
3. Data interaction was unclear and complex
Users struggled to:
- Understand how to manage datasets from telcos and service providers
- Interact with large volumes of operational data
This created barriers to efficiency and increased dependency on external support.
4. Billing and revenue distribution lacked transparency
Due to regulatory requirements, users needed to:
- Manage billing
- Distribute revenue across stakeholders
However:
- There was no clear process or system to support this
This introduced risk, uncertainty, and potential financial errors.
5. Lack of visibility into transactions
Stakeholders required:
- A transparent system
- Clear visibility into ongoing transactions
Without this, trust and accountability were compromised.
Product Goals
Based on research findings, we defined the following key goals:
Centralized Data Management
Enable users to:
- Create, view, edit, categorize, and delete data
- Work efficiently with both small and large datasets
Billing & Revenue Control
Provide tools to:
- Define and manage revenue splits
- Ensure compliance with regulatory requirements
Reporting & Insights
Allow users to:
- Generate reports across datasets
- Monitor performance and transactions
Role-Based Access Control
Enable:
- User management
- Role assignment for different stakeholders
Ensures security and operational control across the system.
Design Approach
To refine the solution, I:
- Conducted iterative brainstorming sessions with stakeholders
- Analyzed market patterns and available competitor features
- Translated business requirements into structured user flows and system logic
Solution
Based on research and iterative design, I developed a system centered around core operational workflows.
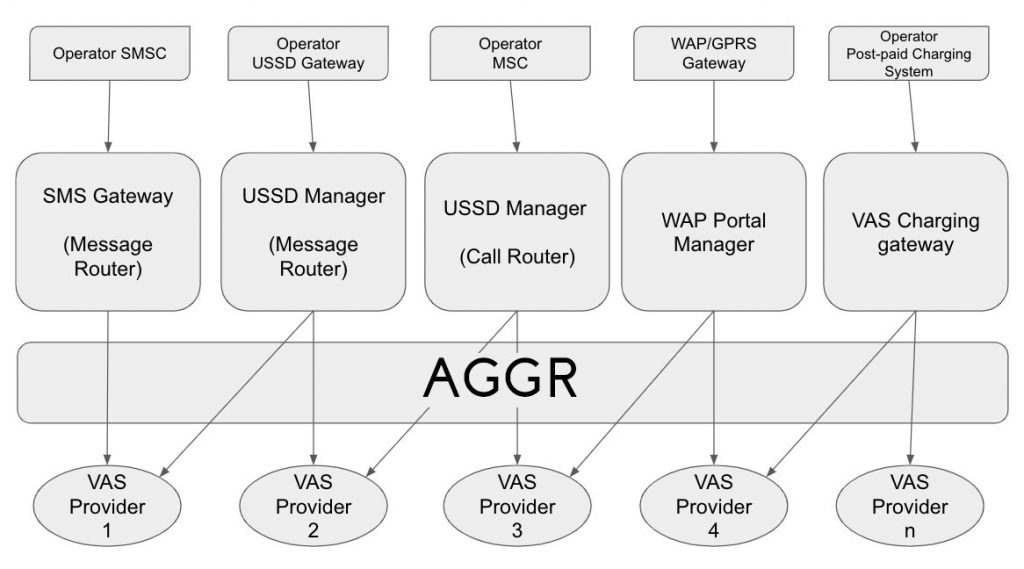
Based on the model above and leaning into the research findings the following modules were developed.
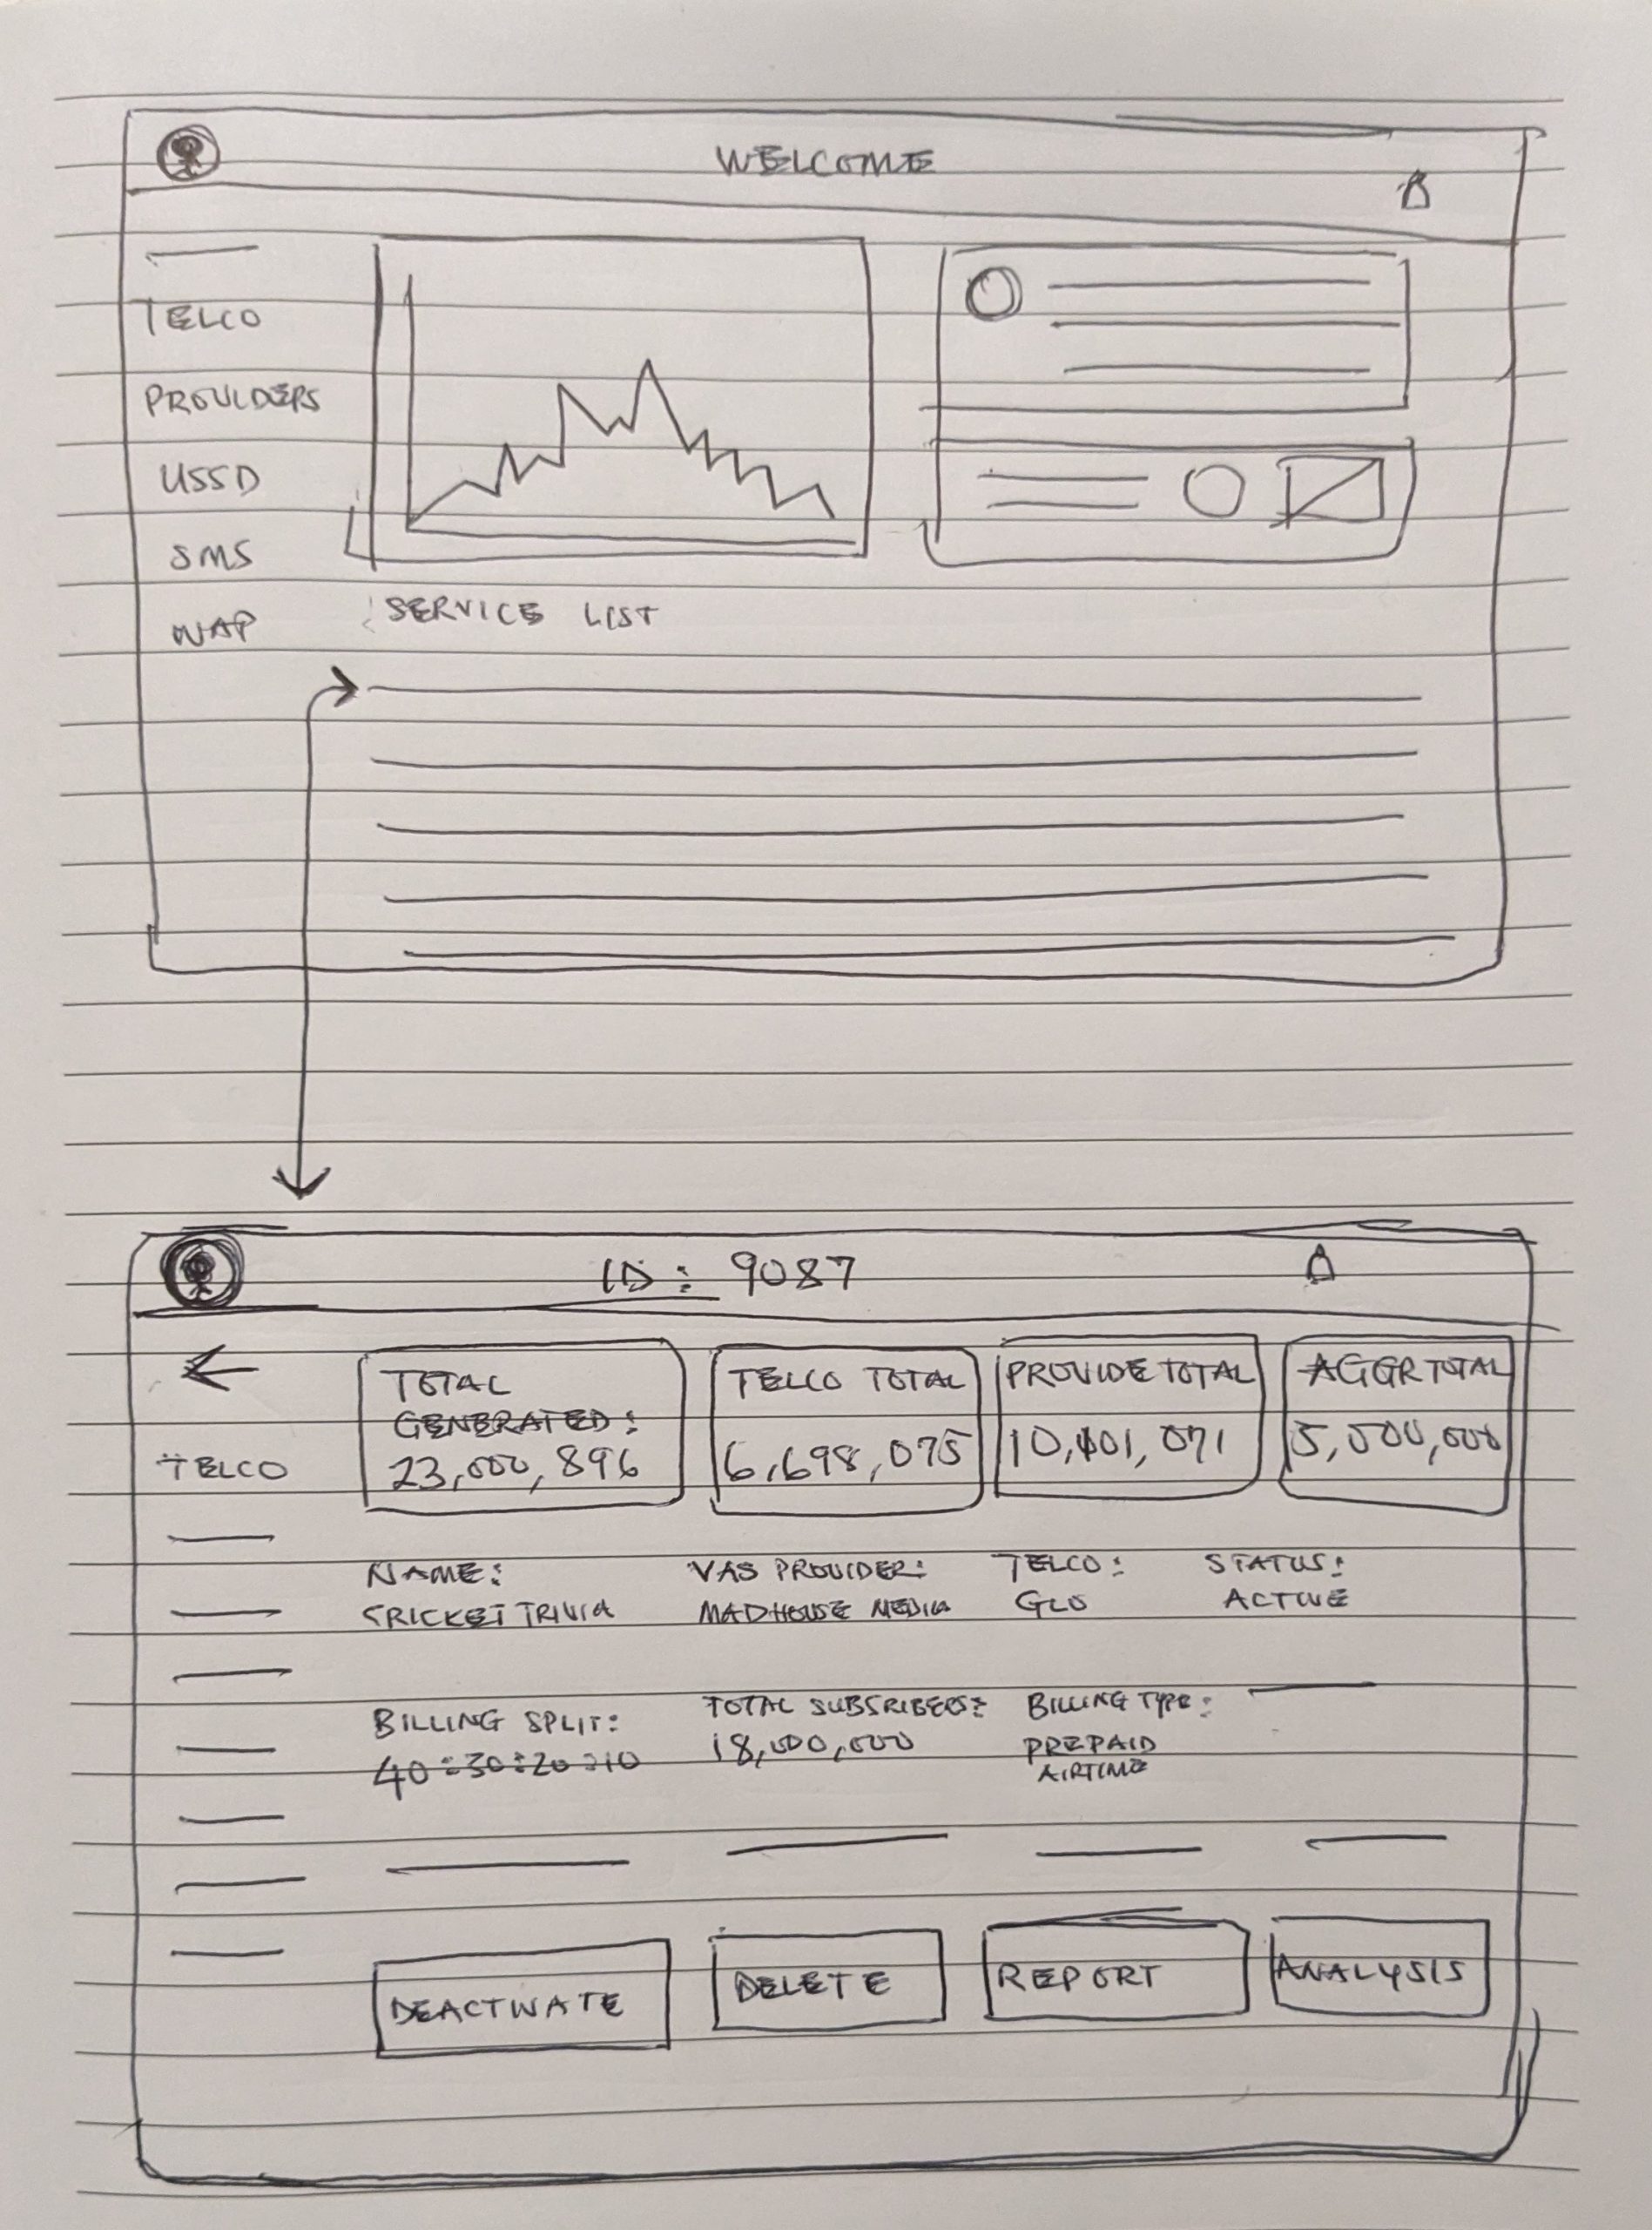
Unified Service Management
Designed a flexible system allowing users to:
- Create, edit, and manage multiple service types:
- Telcos
- Service providers
- SMS, USSD, IVR, WAP
Despite similar workflows, each service type supports custom parameters, ensuring flexibility.
Interaction Design & User Flows
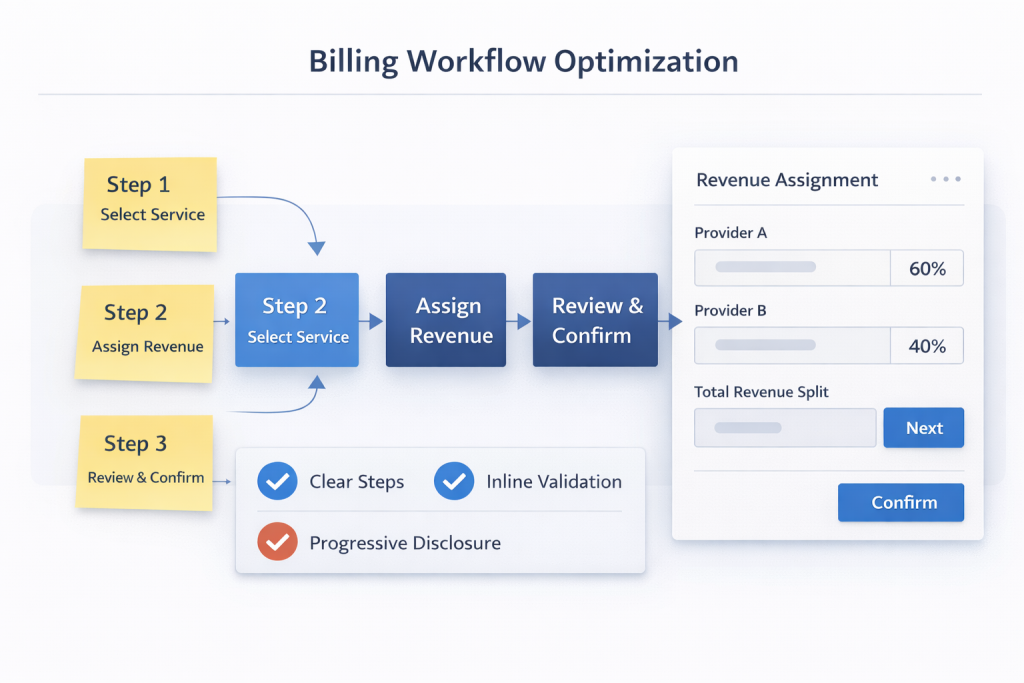
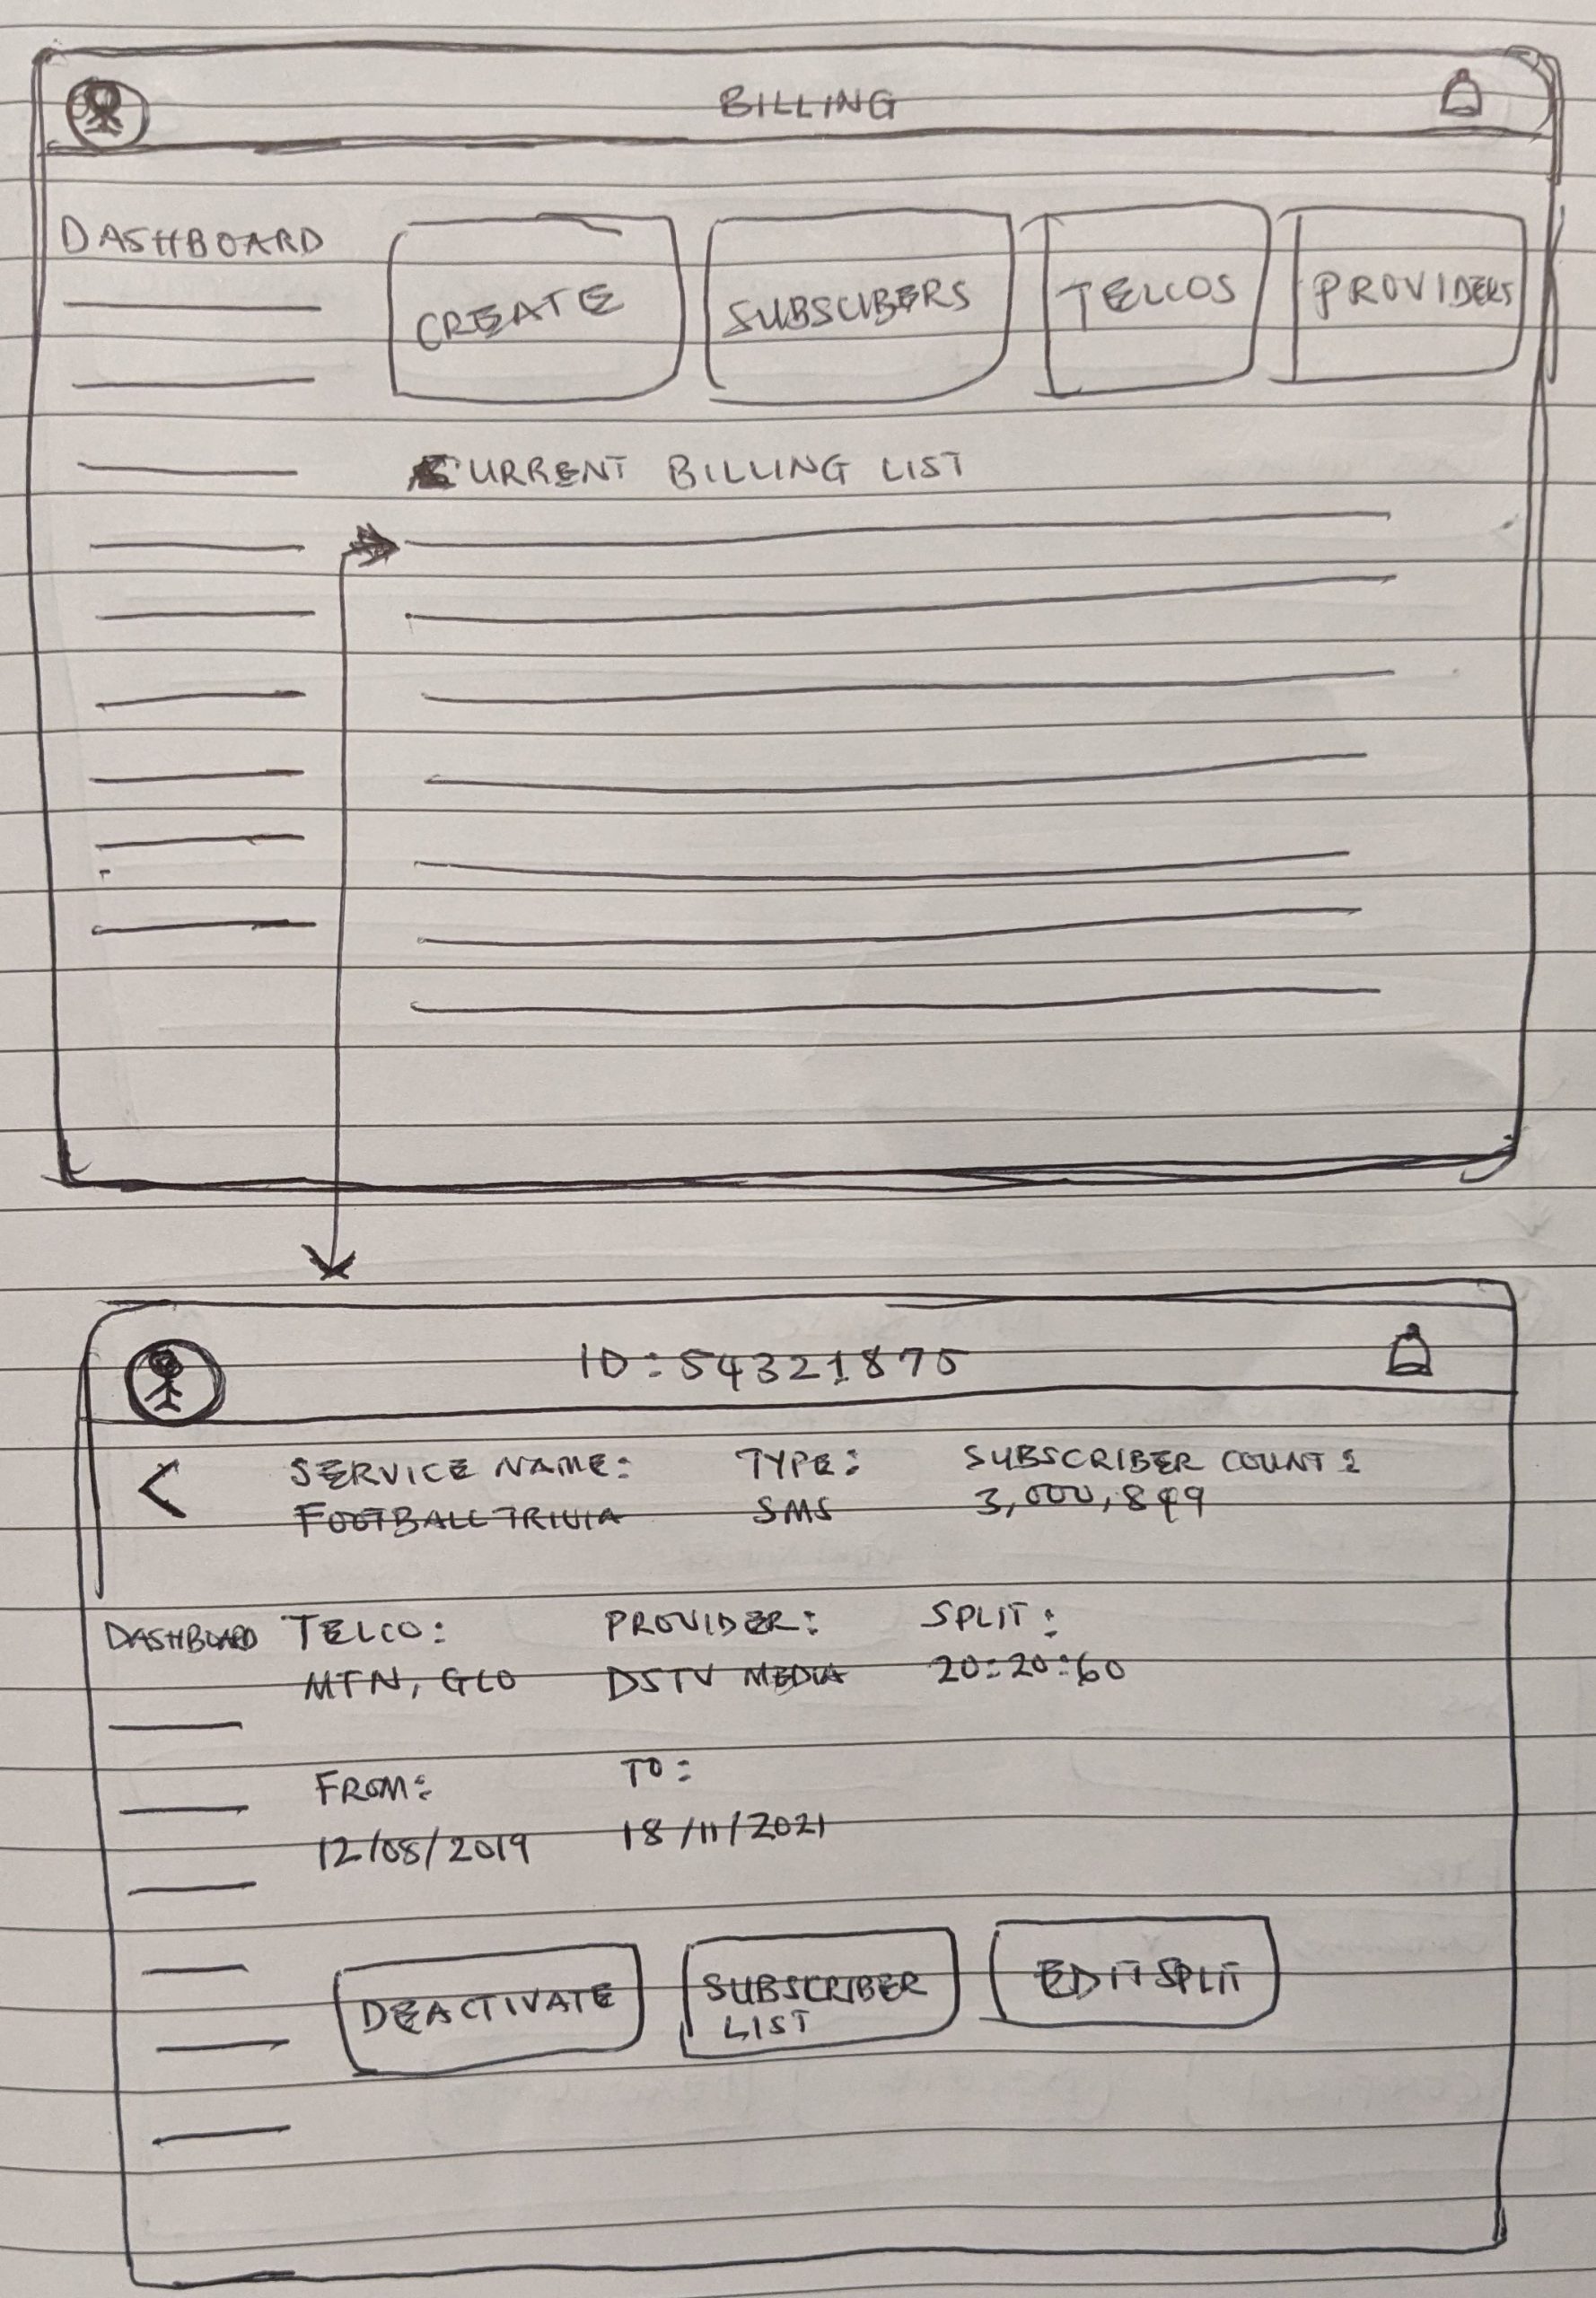
Billing & Revenue Assignment System
Clear separation between configuration and execution
Inline validation to prevent incorrect revenue allocation
Progressive disclosure for advanced settings
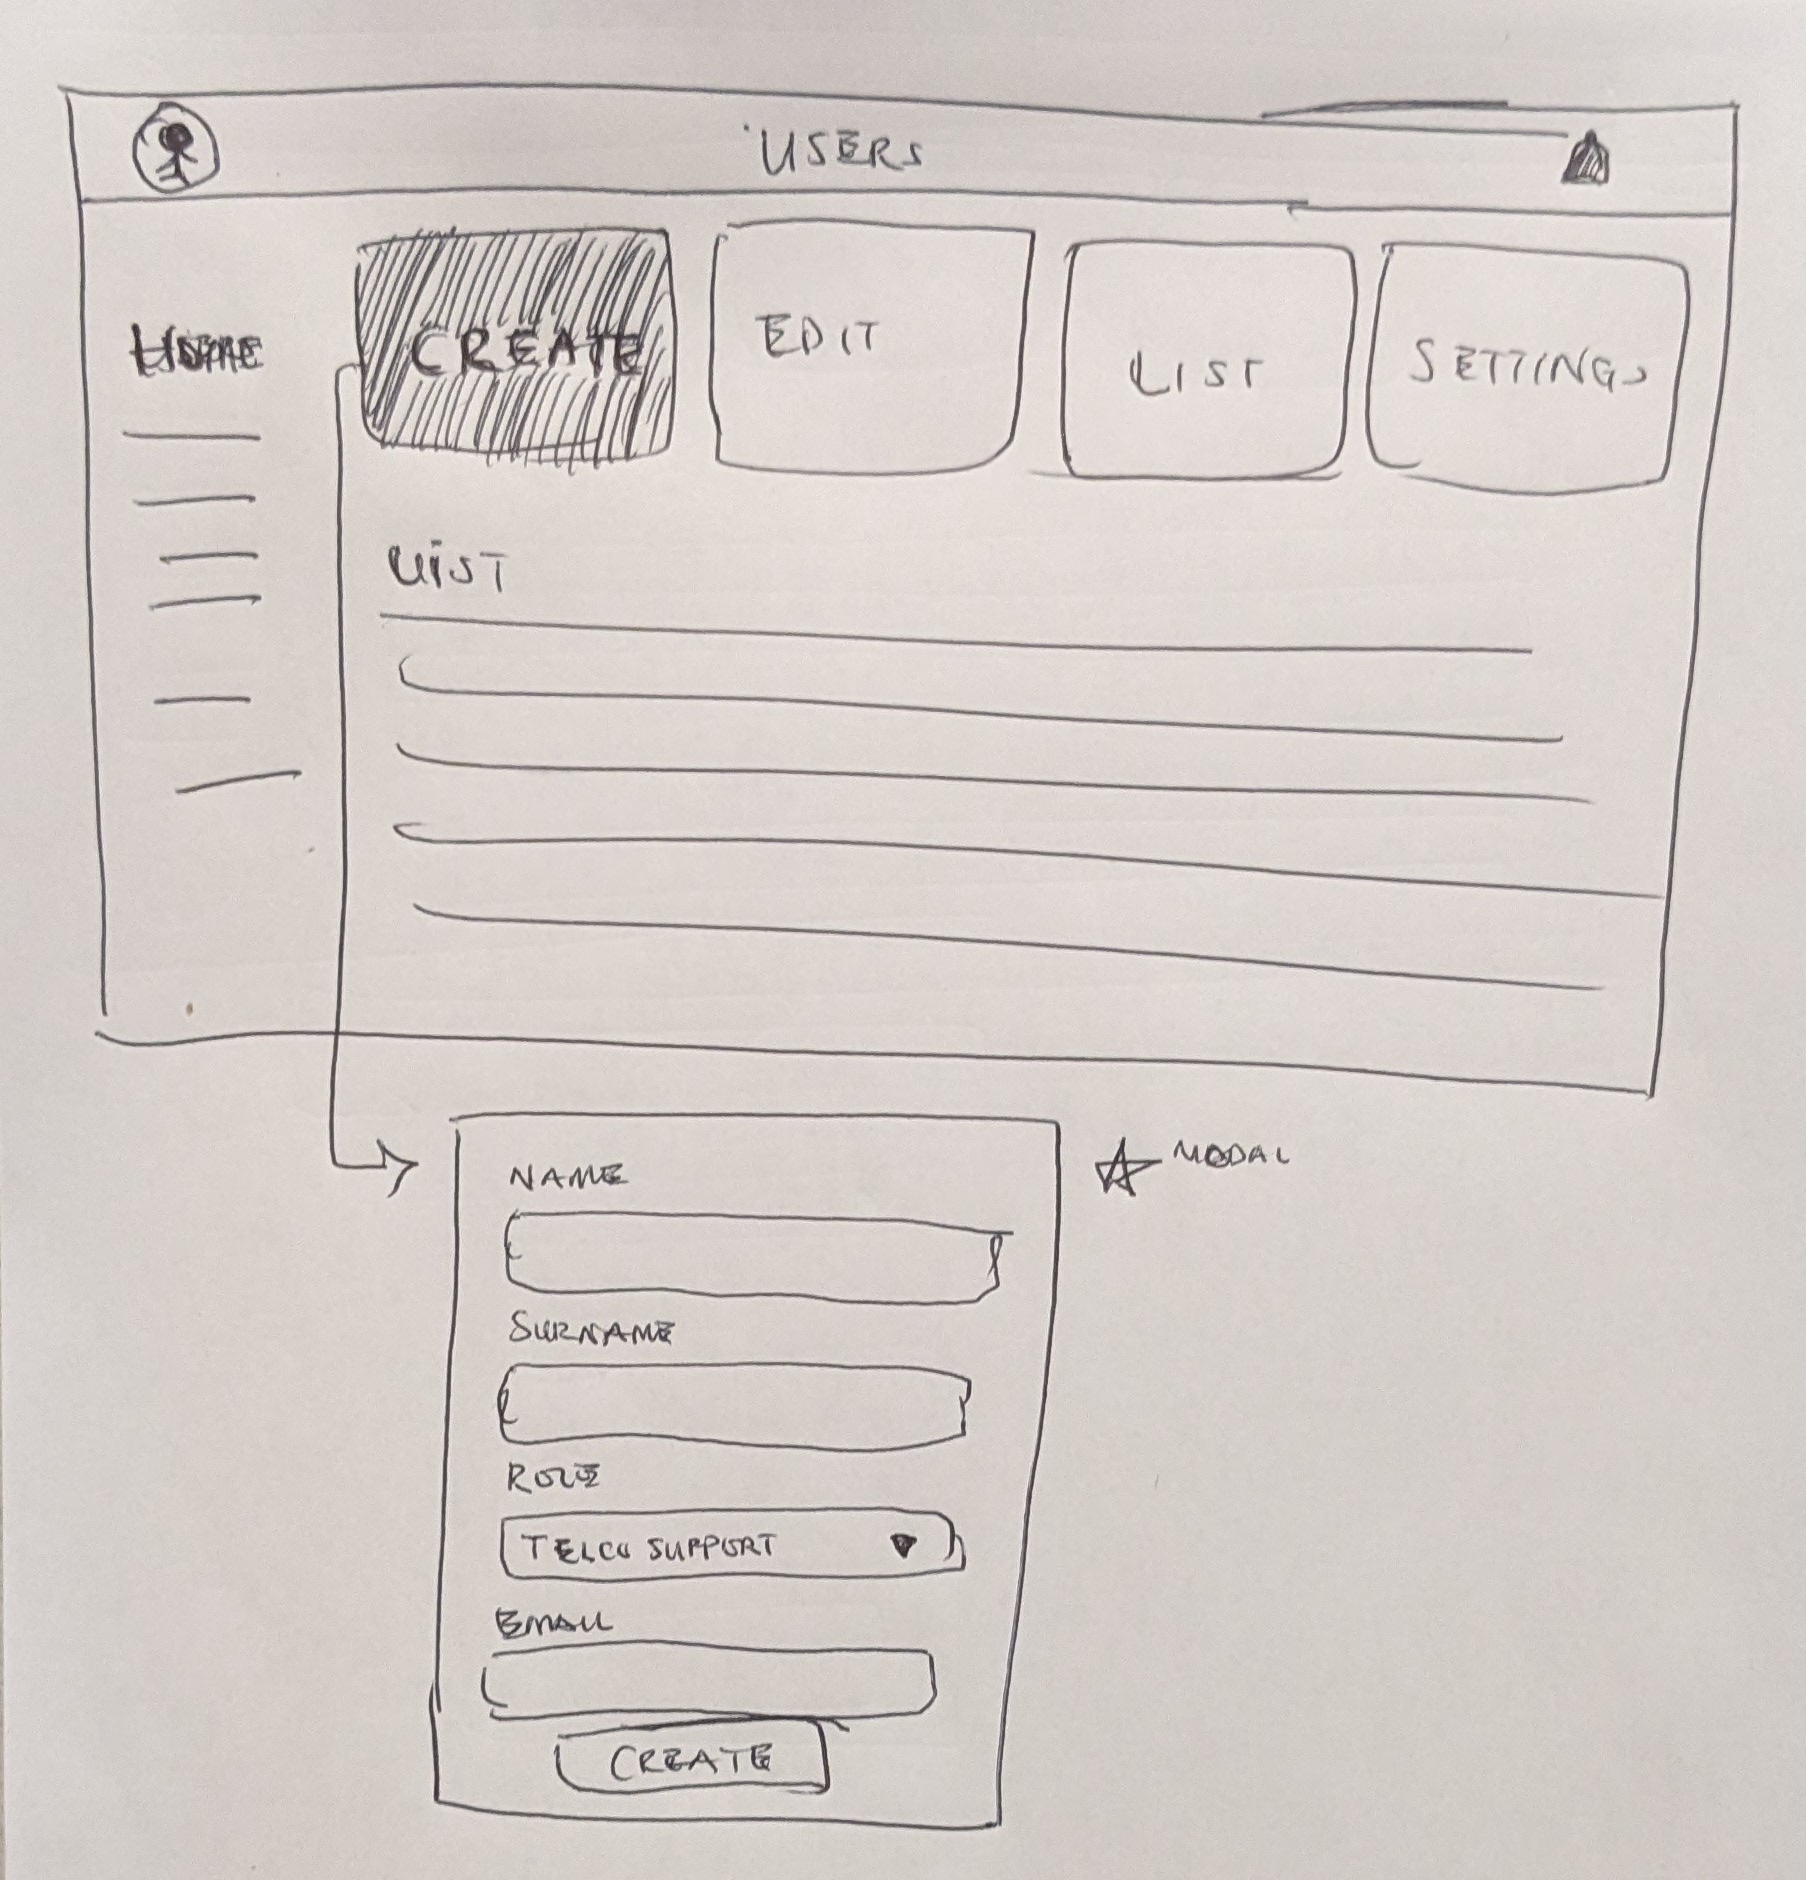
User & Role Management
Designed a role-based system enabling:
- Adding users
- Assigning permissions based on responsibilities
Supports scalability and secure collaboration.
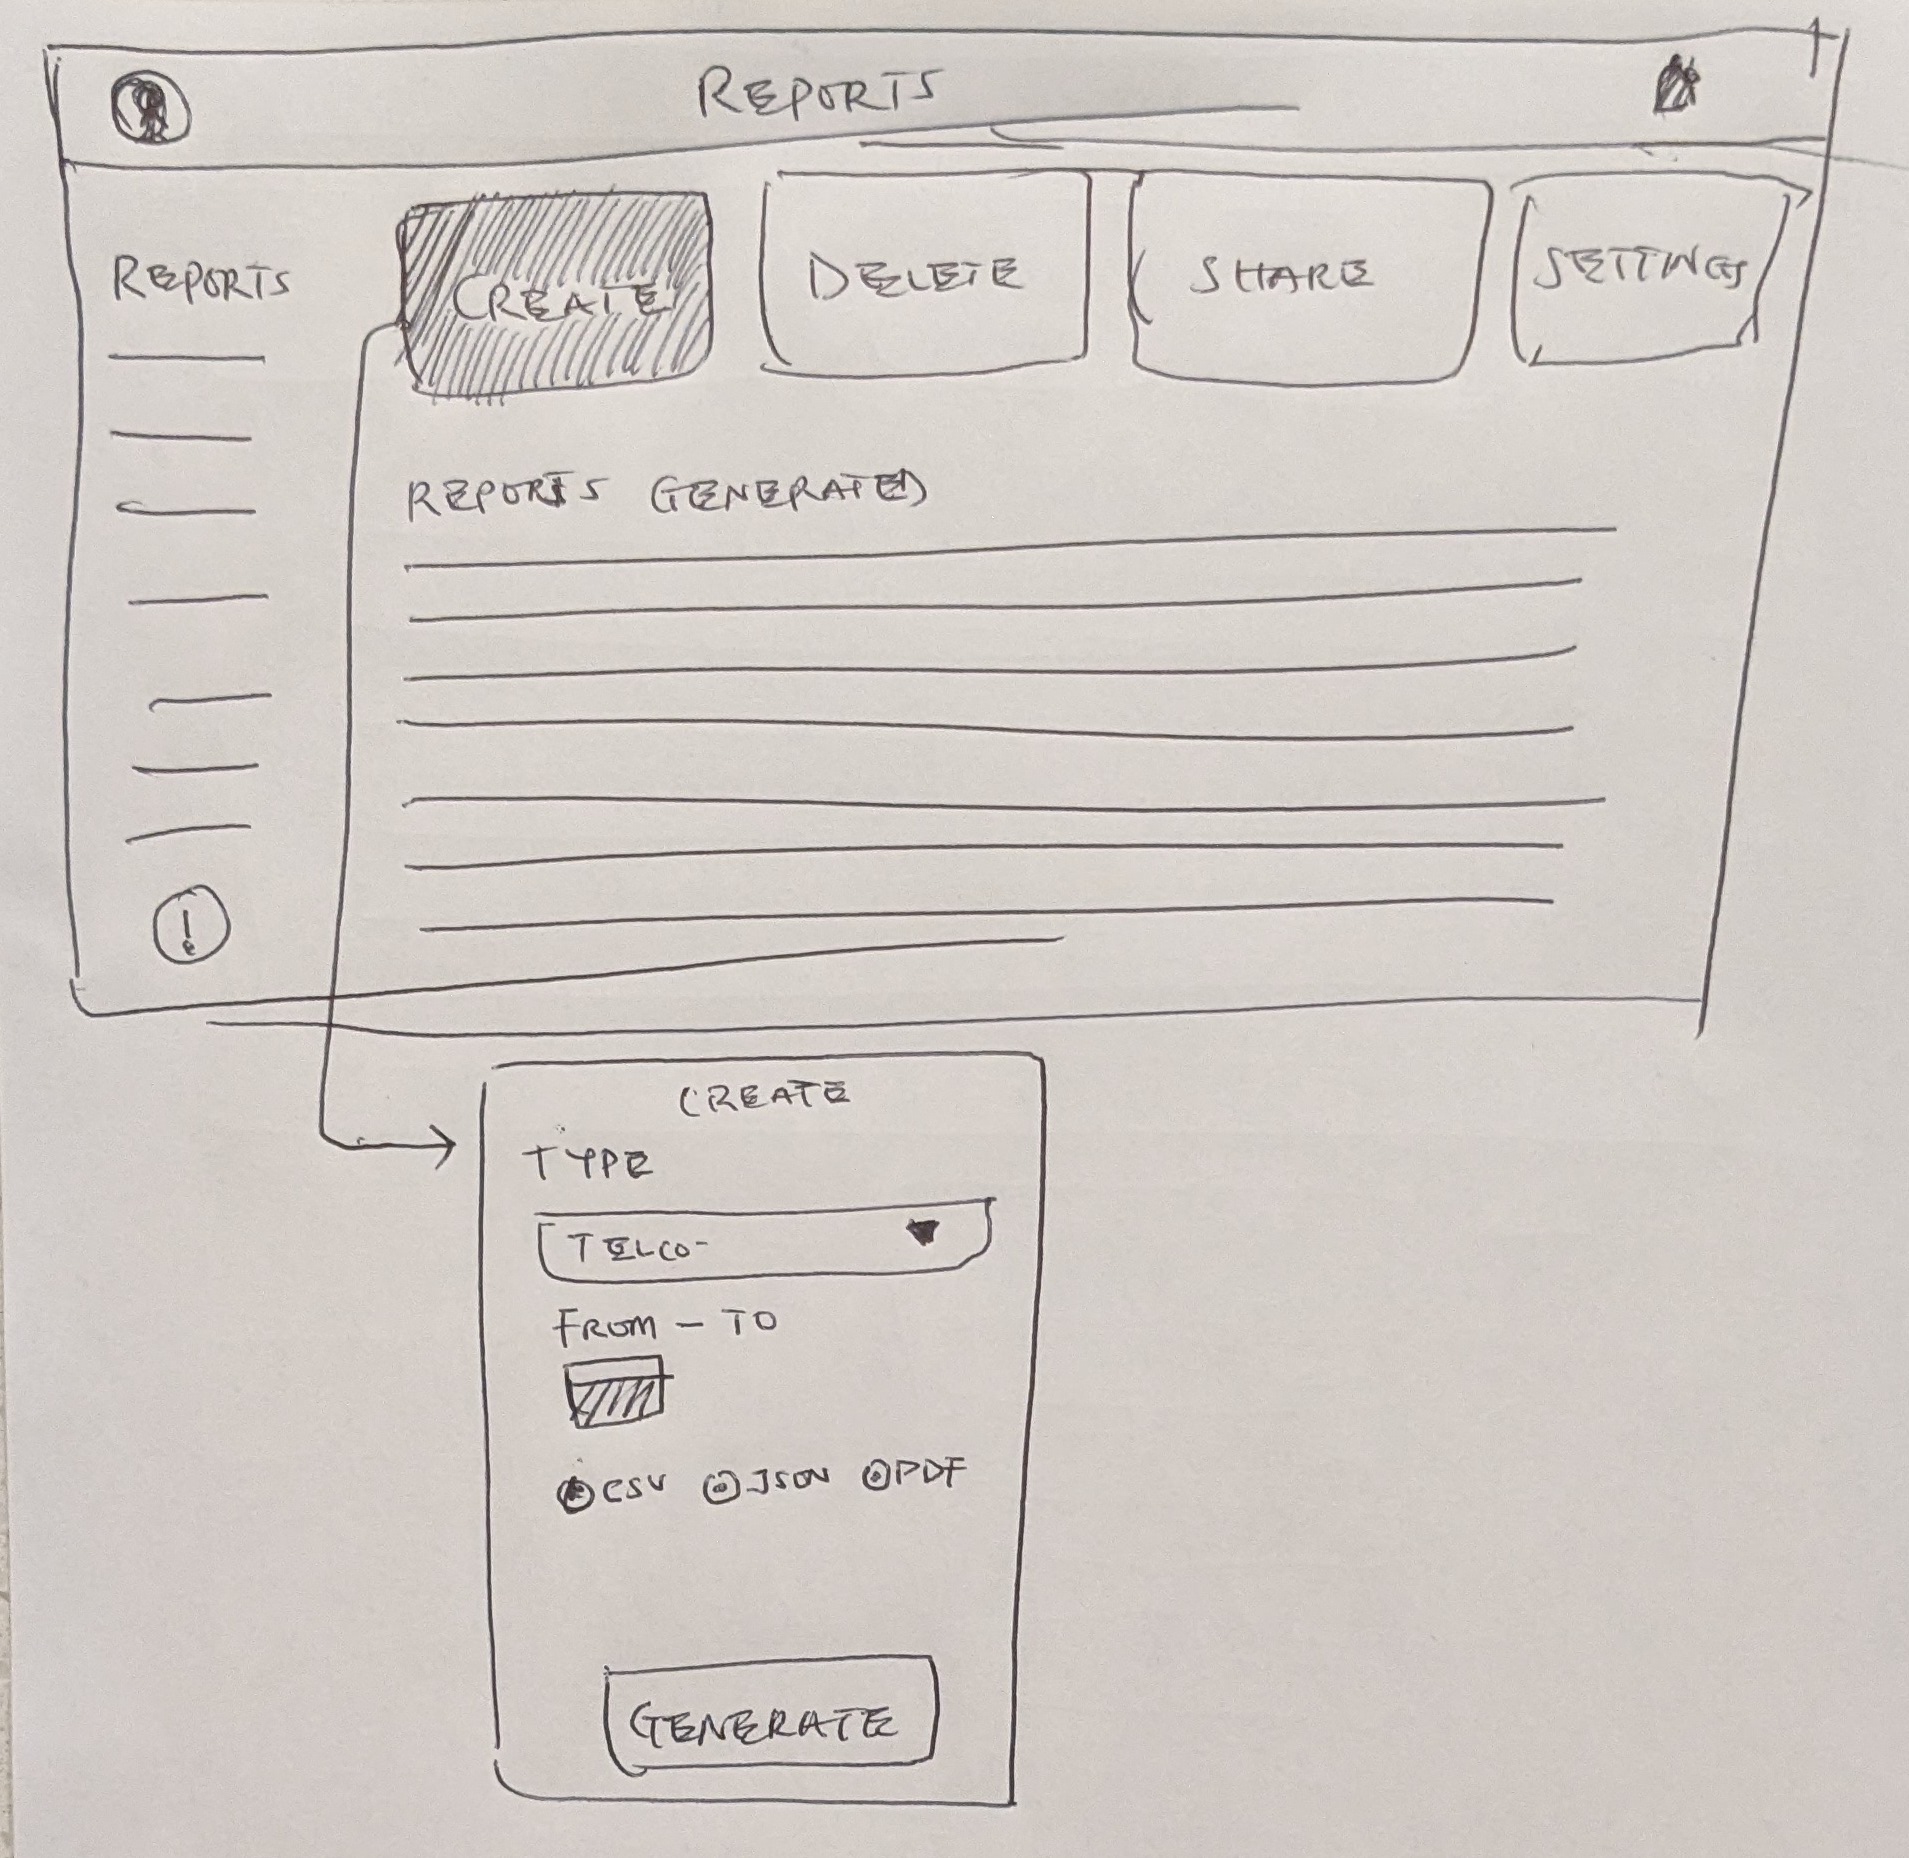
Reporting & Data Visibility
Enabled users to:
- Generate reports across datasets
- Track transactions and system activity
Improves decision-making and operational oversight.
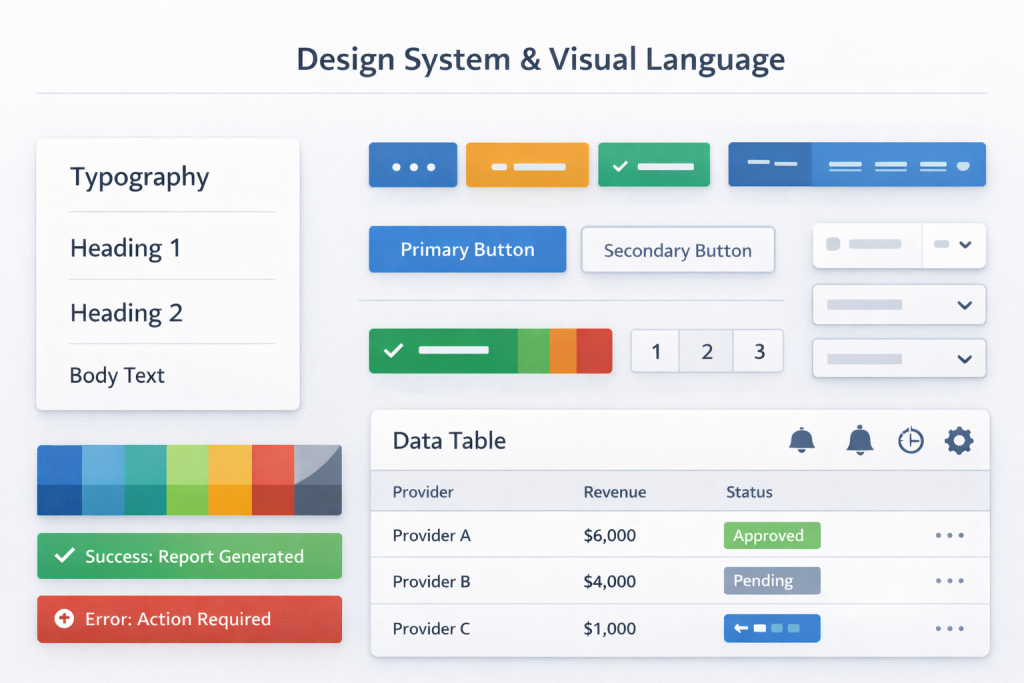
Design System & Visual Language
The UI emphasizes:
High contrast for data readability
Consistent component patterns for tables and forms
Clear status indicators for system feedback
Visual decisions prioritized usability and accuracy over aesthetics, aligning with enterprise UX best practices.
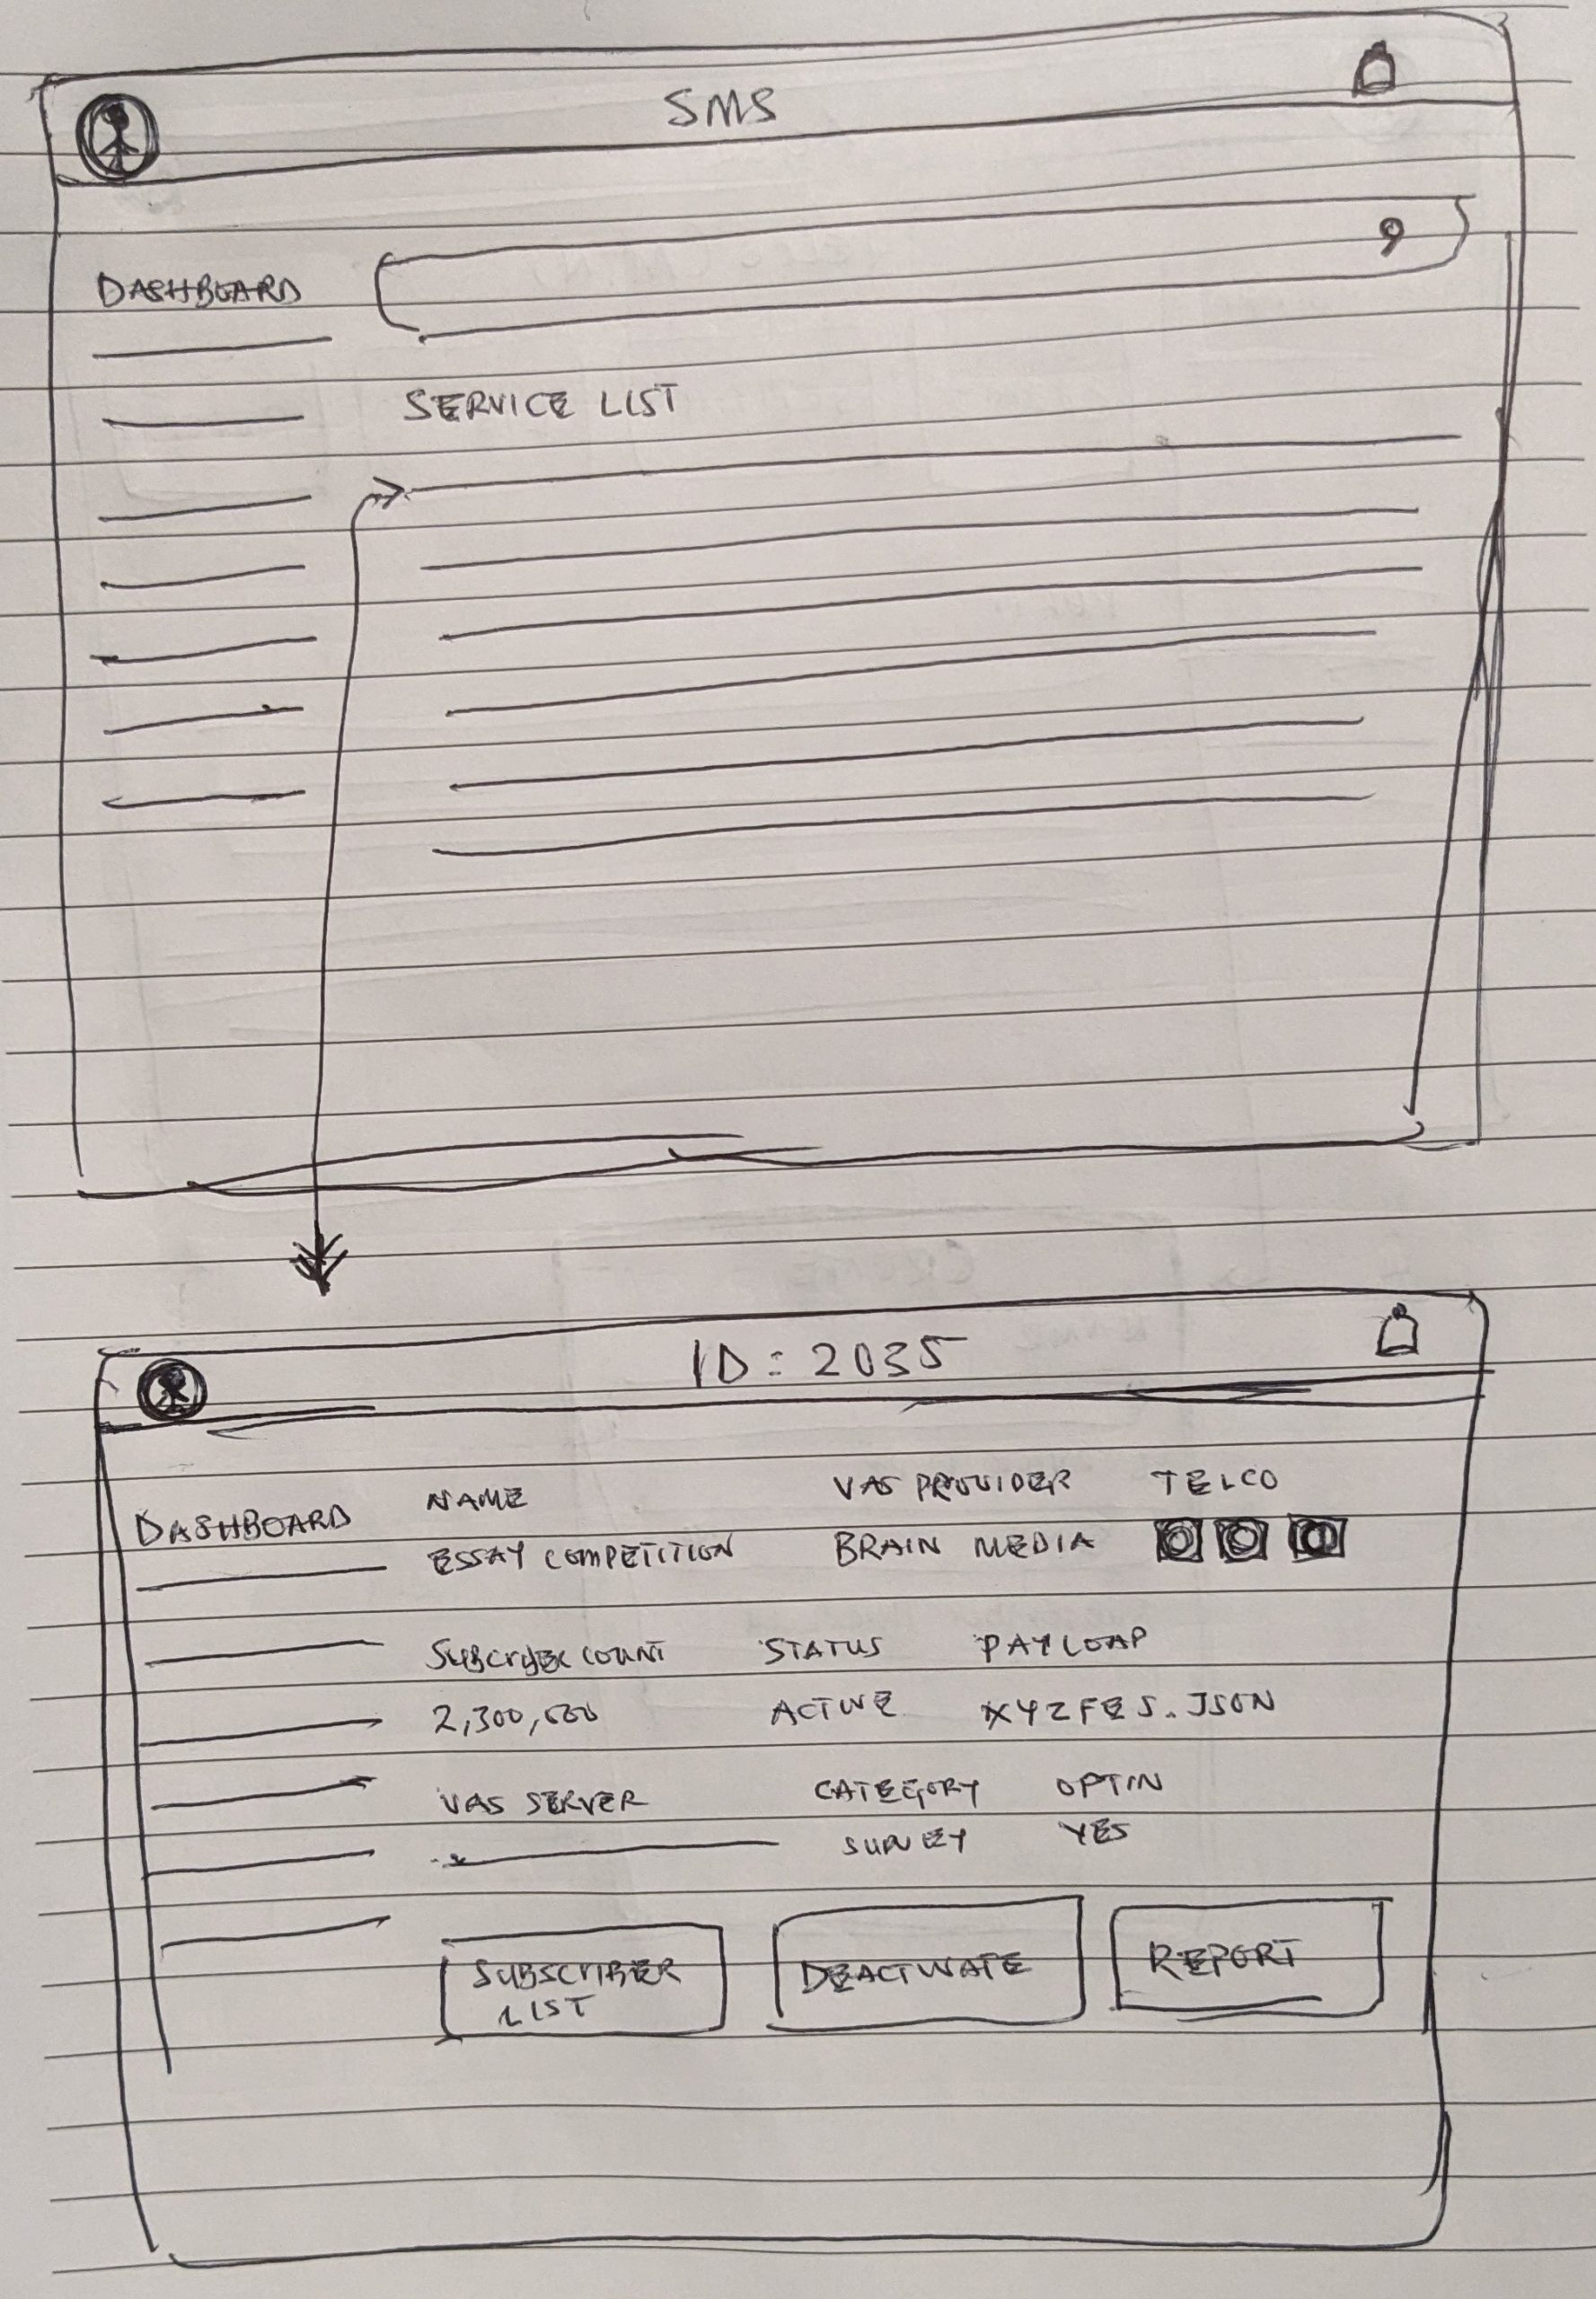
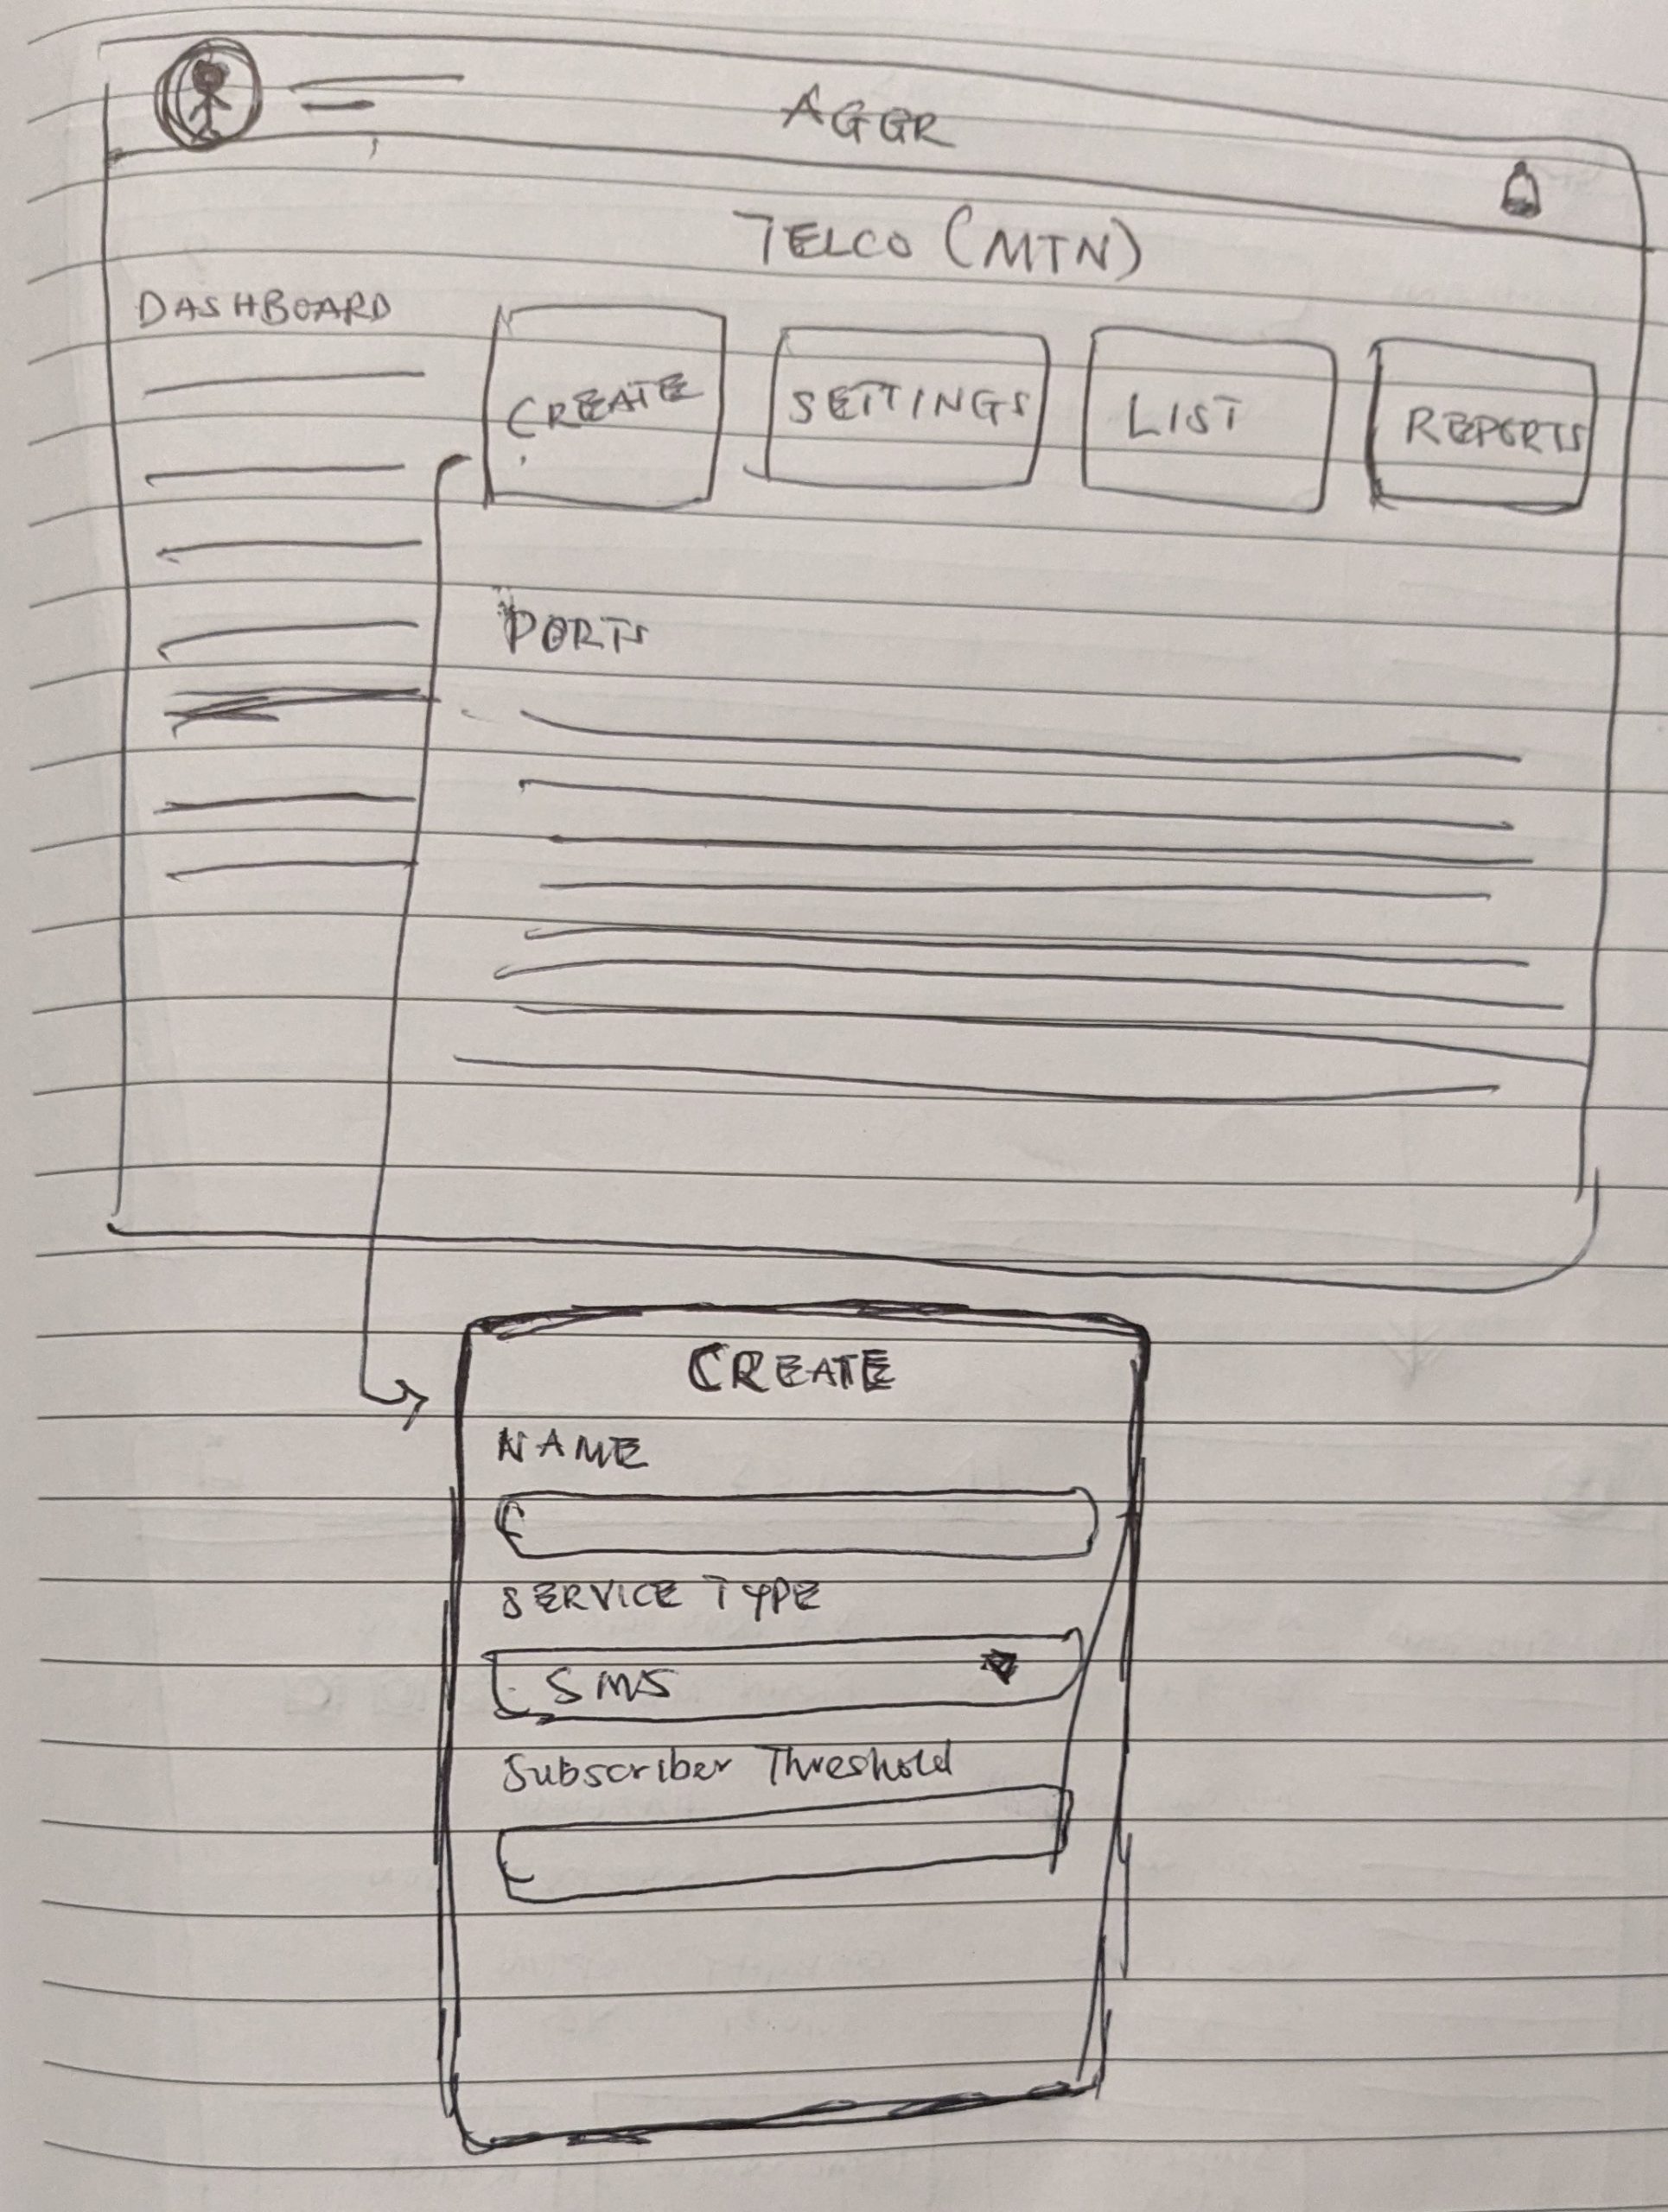
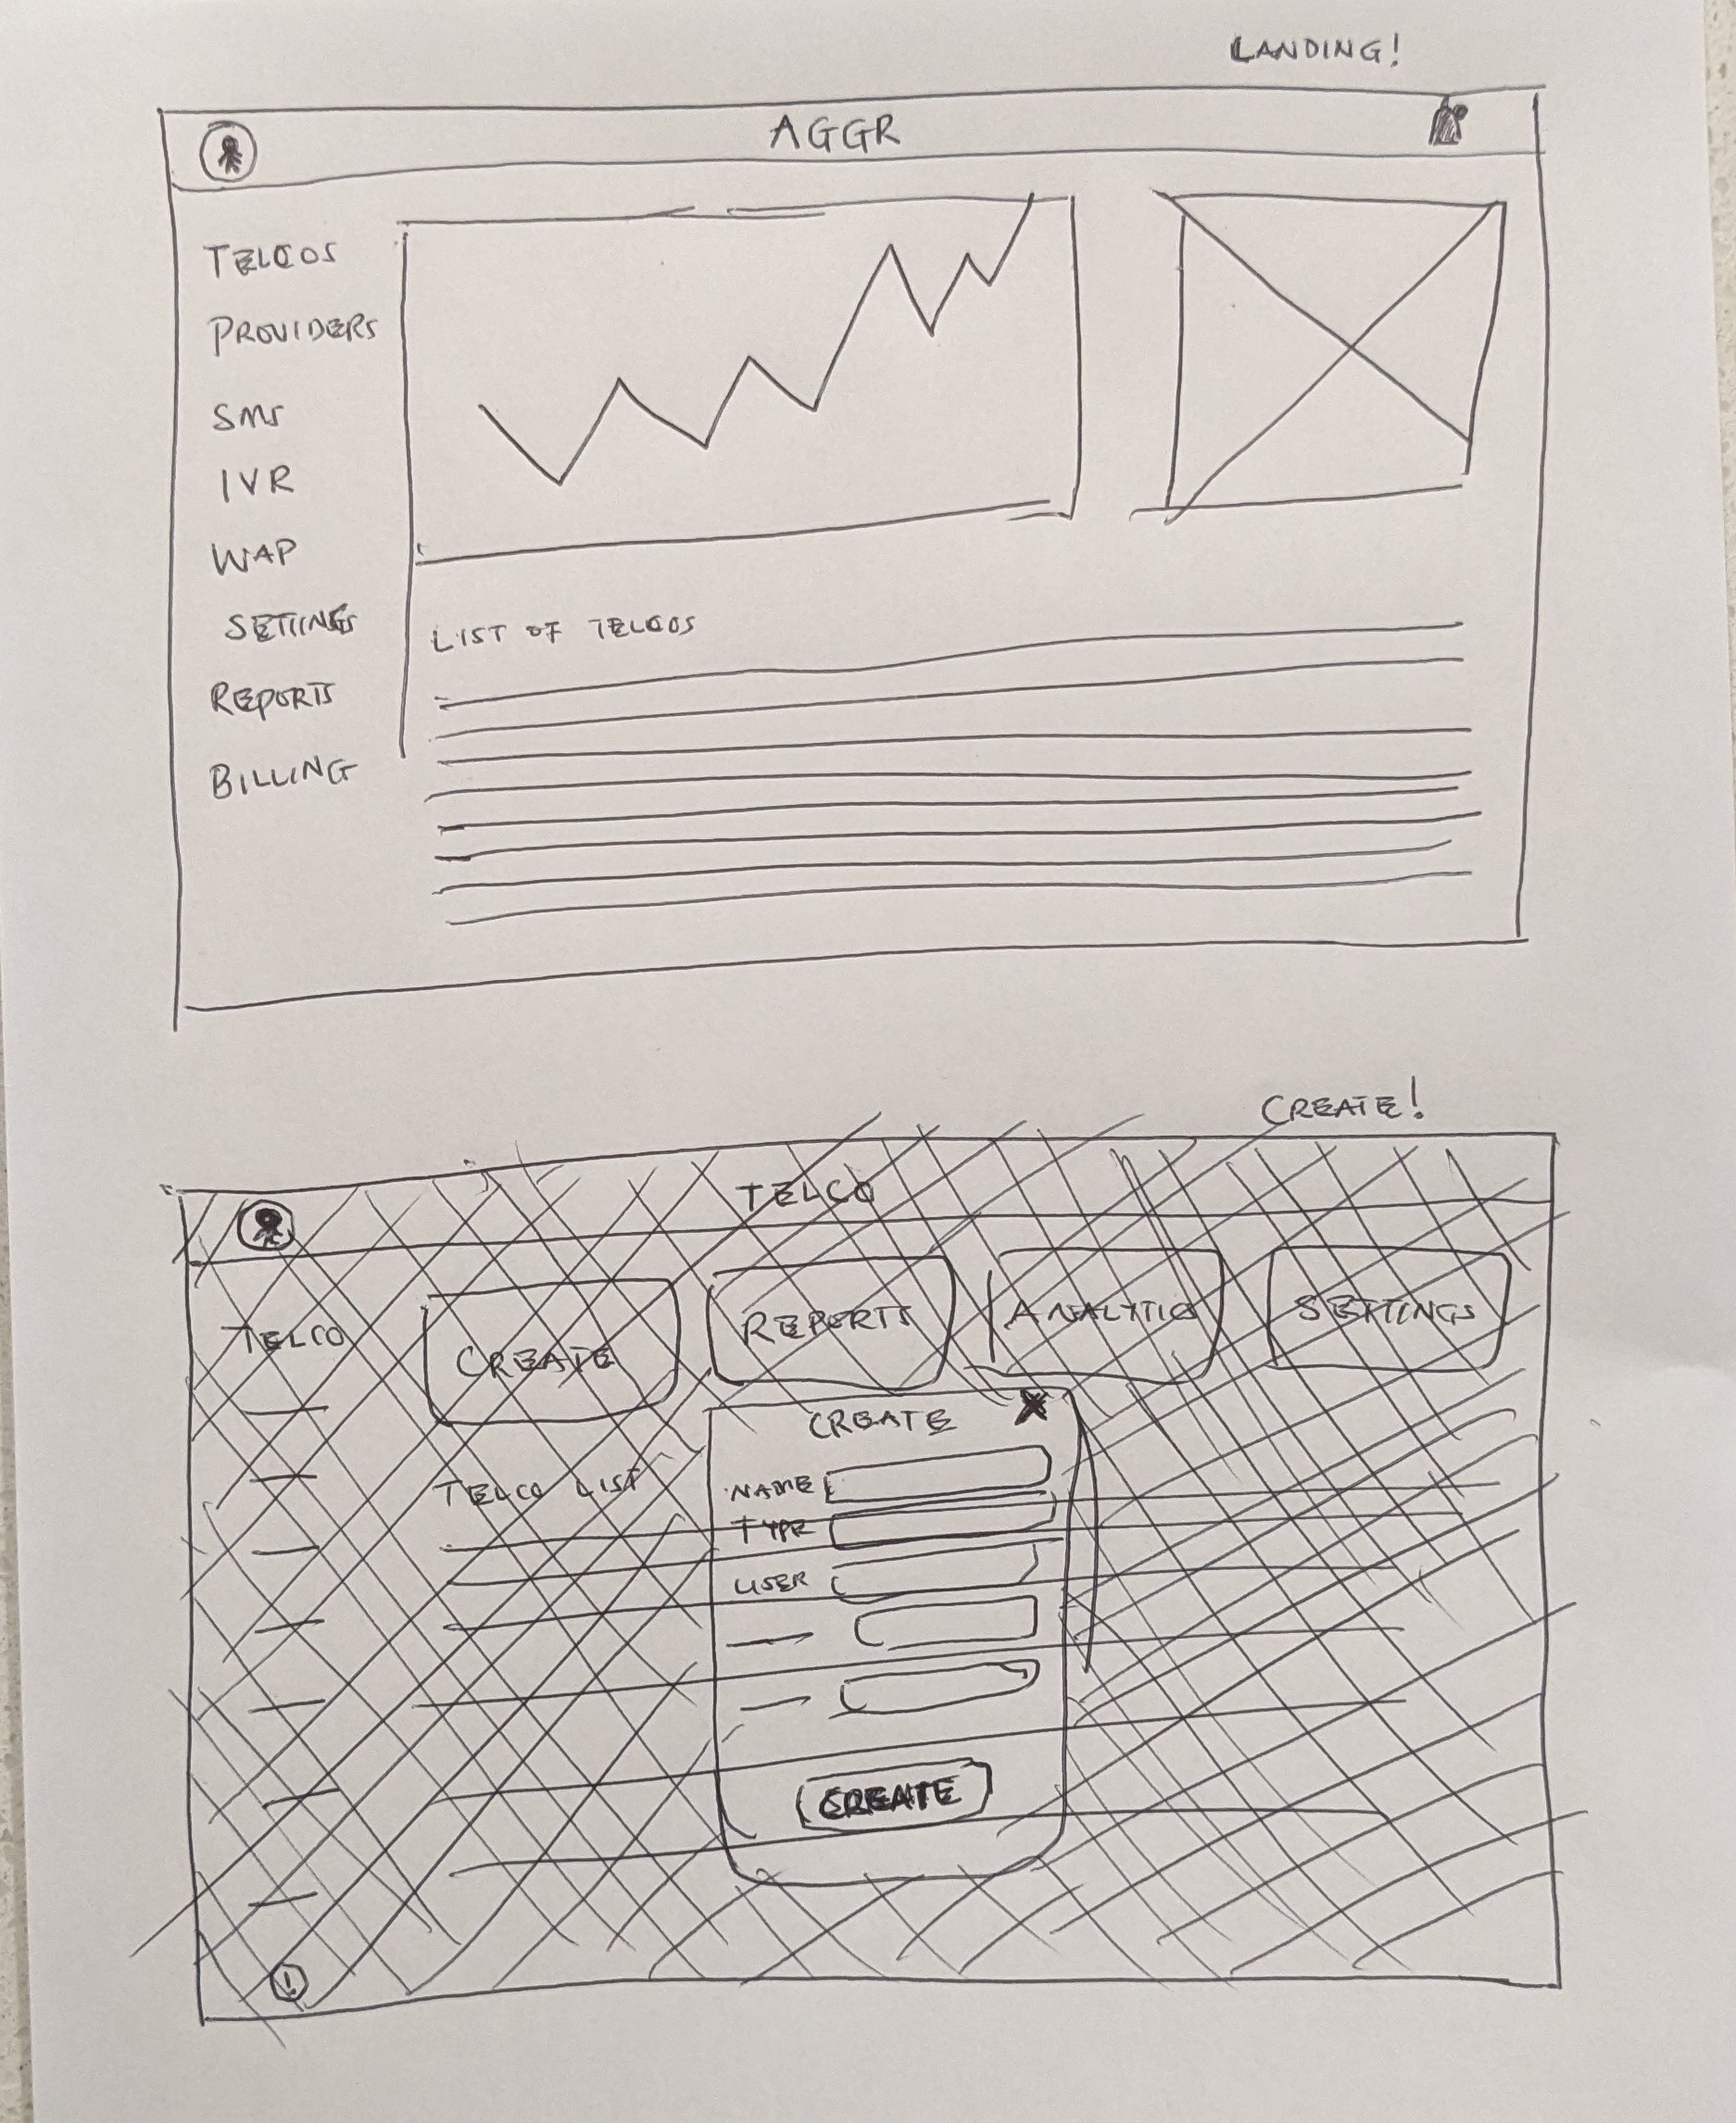
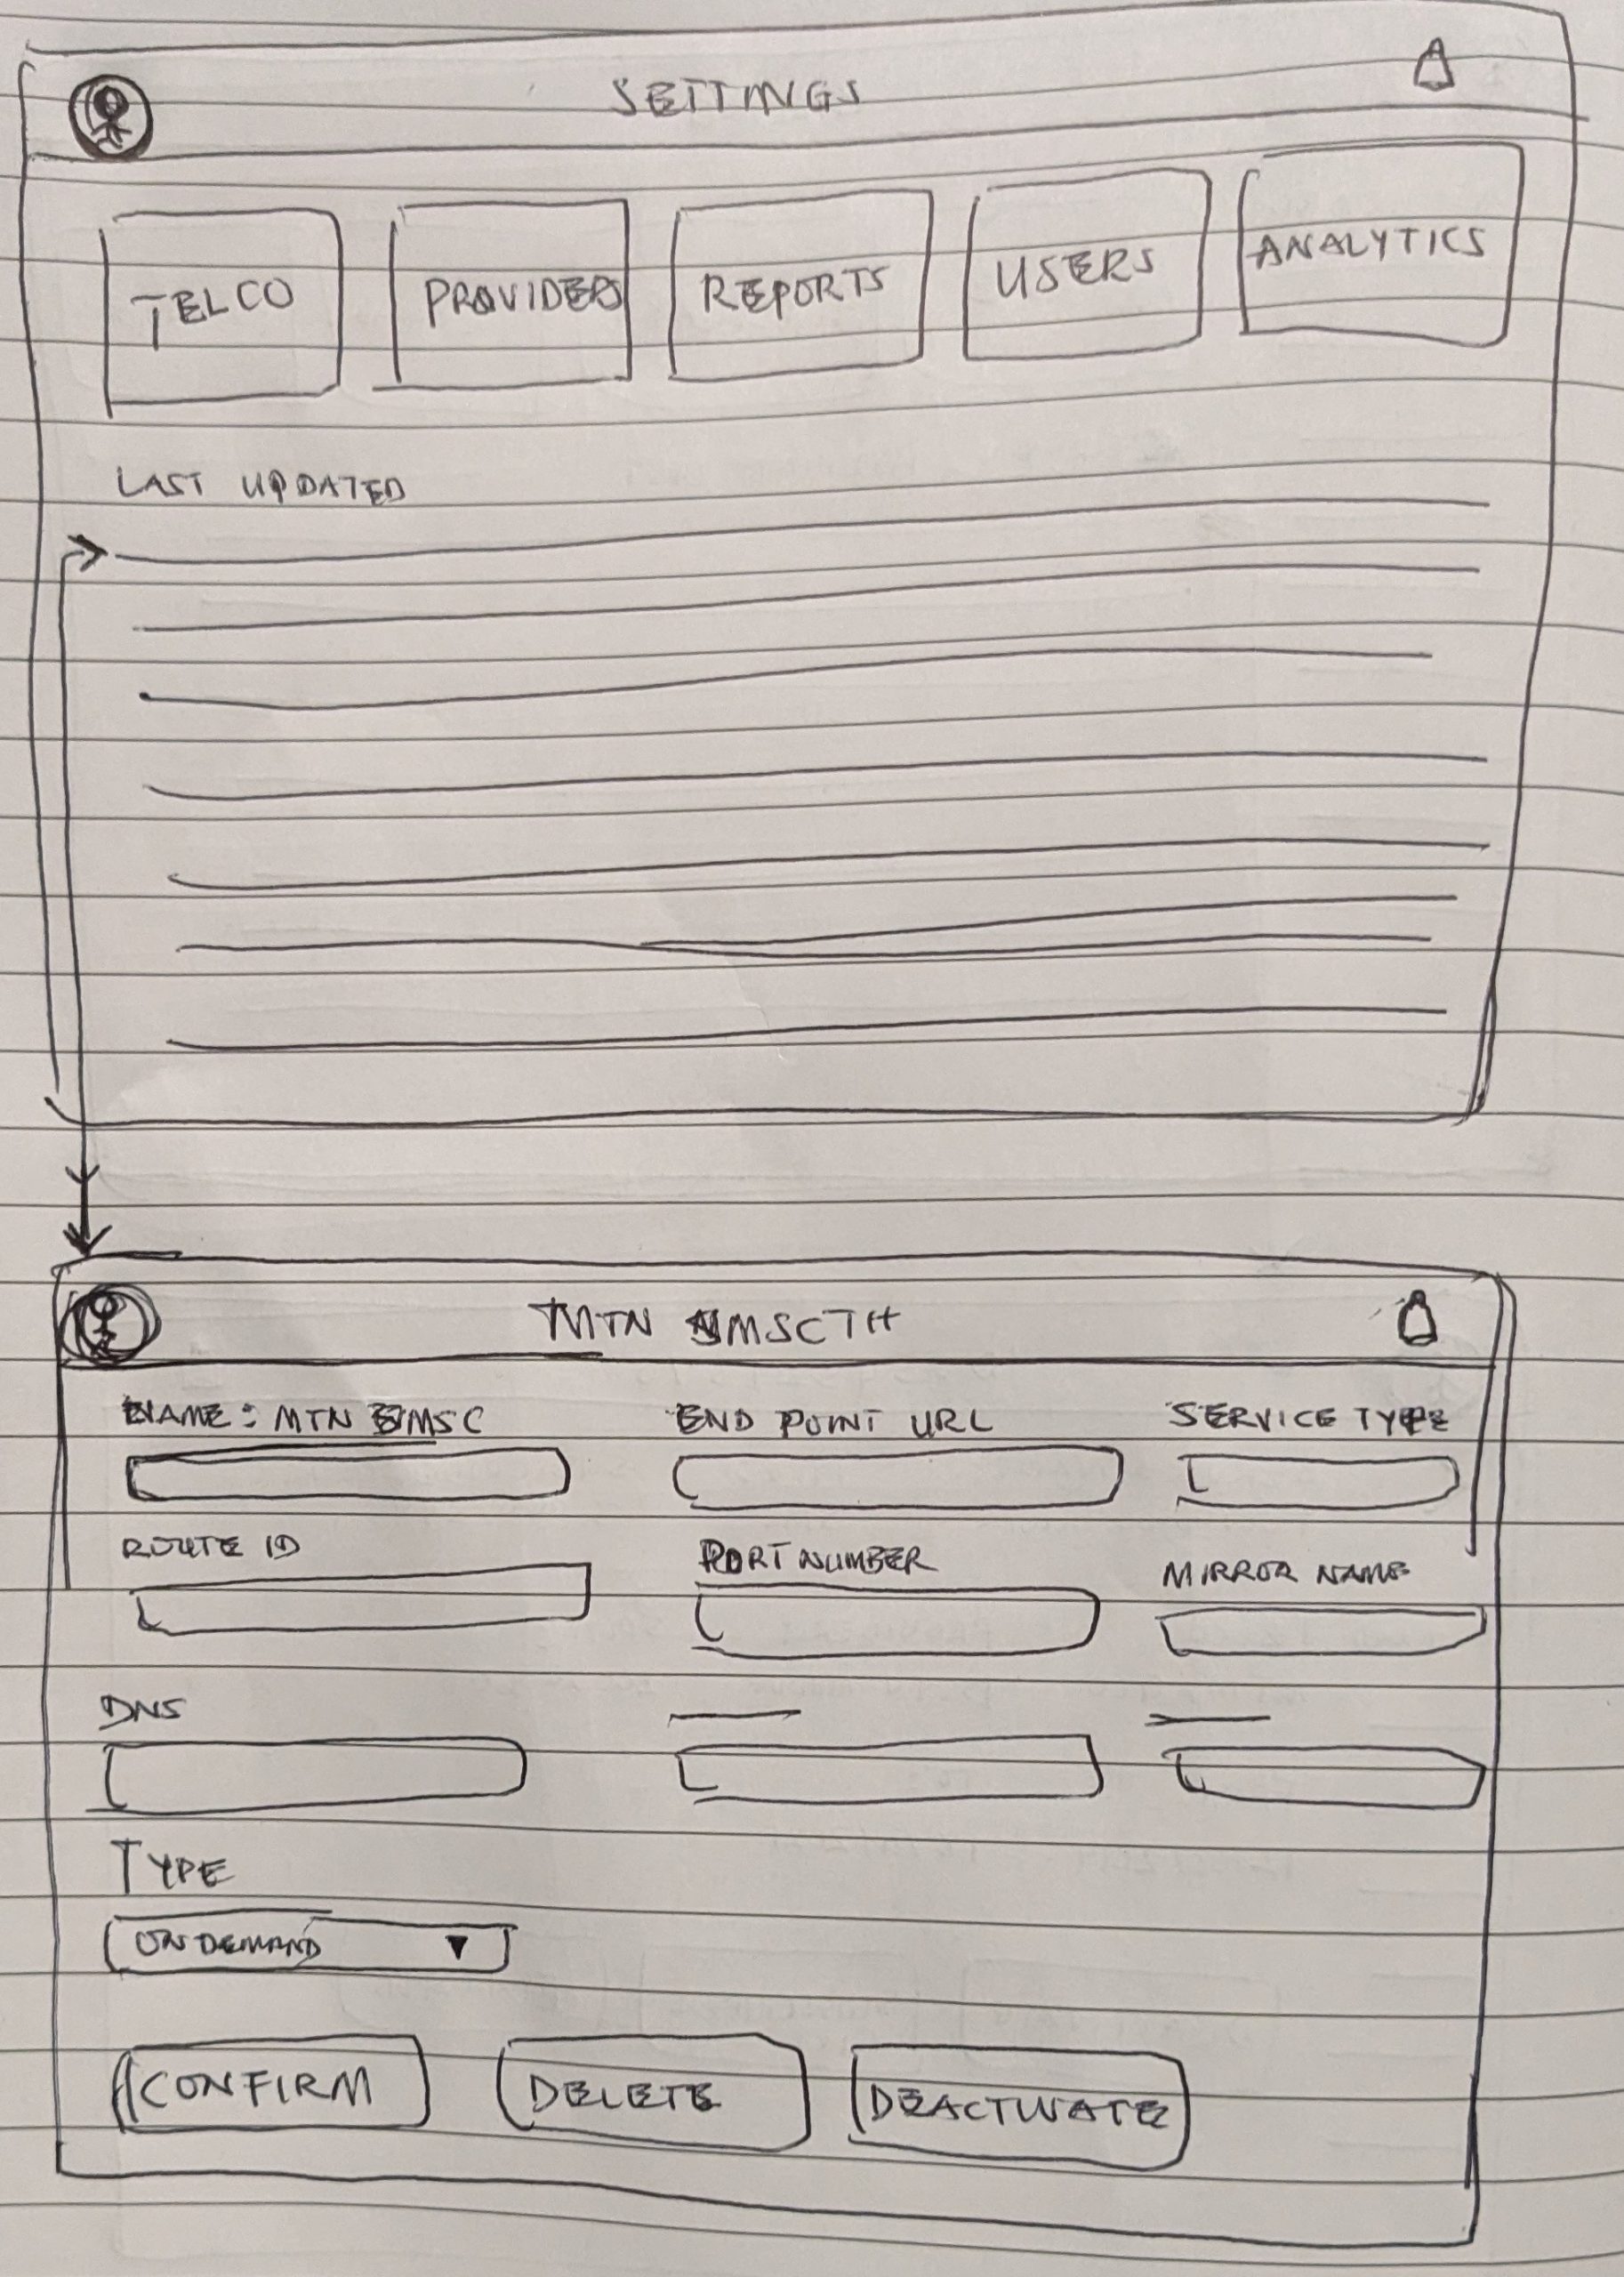
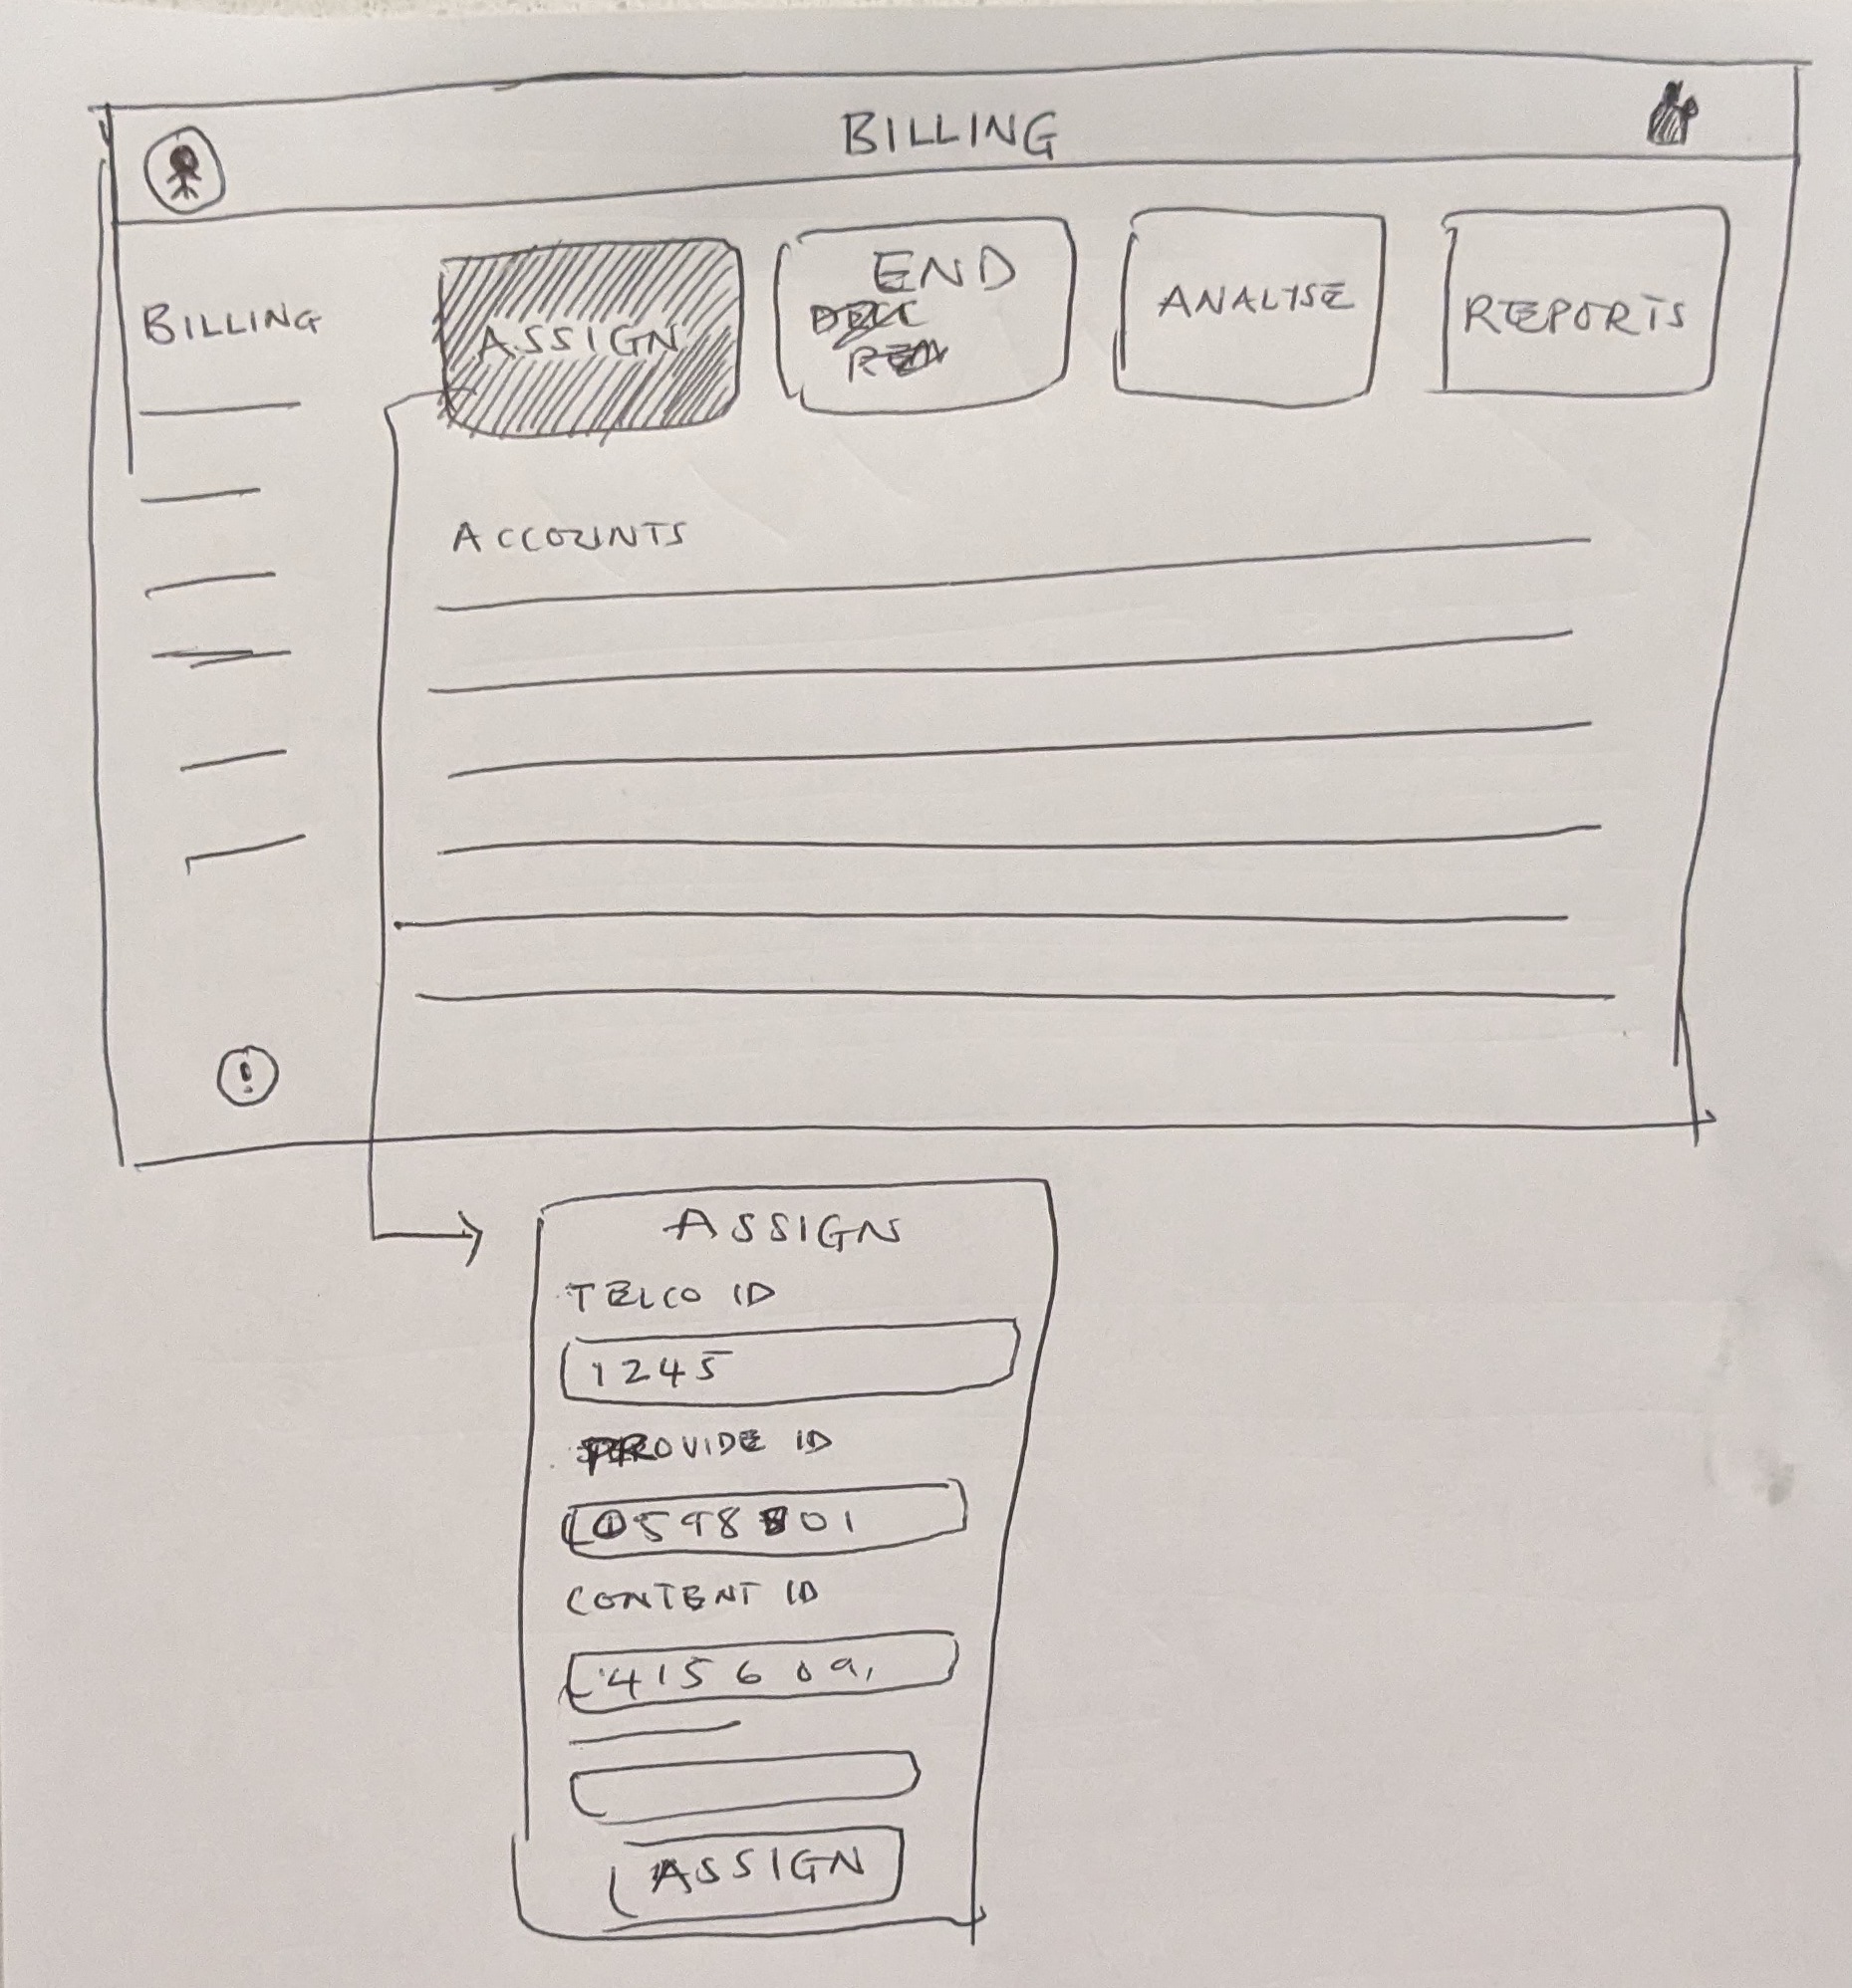
Low Fidelity Mockup
The UI emphasizes:
High contrast for data readability
Consistent component patterns for tables and forms
Clear status indicators for system feedback
Visual decisions prioritized usability and accuracy over aesthetics, aligning with enterprise UX best practices.
High-fidelity mock-up & Prototype
Click the button below to explore the wireframes and prototype can be found via this link.
Validation & Outcomes
Prototype usability testing focused on:
Task completion
Error prevention
Perceived clarity of workflows
Results
85% task success rate across billing and reporting scenarios
Users reported increased confidence performing high-risk actions
Feedback highlighted improved clarity compared to existing tools
Impact:
The redesigned platform is expected to:
- Reduce operational inefficiencies caused by fragmented systems
- Improve clarity in data interaction and workflow execution
- Increase transparency in billing and revenue distribution
- Enable faster task completion for high-frequency operations
- Strengthen trust across stakeholders through better visibility
Reflections & Next Steps
Key Learnings
This project emphasized the importance of:
- Designing for systems, not just screens
- Aligning UX decisions with business rules and regulatory constraints
- Simplifying complex workflows without losing flexibility
If I were to iterate further, I would:
- Validate workflows through usability testing with real operators
- Measure task efficiency and error rates
- Enhance data visualization for large datasets
Next Steps
Conduct longitudinal testing with live data
Expand reporting customization
Refine permission management for larger organizations